Got through to enriched biological processes for the 2021 data set. I also have some short-term goals of what I hope to have done before leaving for our sea star team writing retreat on Quadra on Saturday!
BLAST -ed Genome
I ran BLAST a while ago, but the output genes are transcripts (have the .t# suffix).
Code: paper-pycno-sswd-2021-2022/code/16-blast-genome-annotation.Rmd
BLAST output: paper-pycno-sswd-2021-2022/analyses/16-blast-annotation/blast_out_sep.tab
head blast_out_sep.tab
g3452.t1	sp	Q9Y6A2	CP46A_HUMAN	36.842	380	201	6	73	1119	16	387	6.38e-73	238
g3453.t1	sp	Q9Y6A2	CP46A_HUMAN	39.574	470	267	7	79	1470	20	478	2.82e-111	342
g3454.t1	sp	Q9H4F8	SMOC1_HUMAN	41.026	156	80	3	43	504	21	166	3.34e-31	129
g3455.t1	sp	Q9D844	DNJC4_MOUSE	35.028	177	100	3	100	618	37	202	1.38e-22	95.9
g3456.t1	sp	P80018	GLBC_MOLAR	27.559	127	91	1	115	495	17	142	1.81e-08	54.7
g3457.t1	sp	Q9NRC6	SPTN5_HUMAN	31.110	1649	1112	11	1	4926	1850	3481	0.0	758
g3458.t1	sp	P16546	SPTN1_MOUSE	36.947	655	411	2	67	2028	300	953	1.10e-123	414
g3459.t1	sp	Q00963	SPTCB_DROME	45.908	782	414	4	40	2361	36	816	0.0	691
g3460.t1	sp	Q9WVK8	CP46A_MOUSE	38.248	468	266	9	103	1470	22	478	2.16e-106	329
g3461.t1	sp	Q9Y6A2	CP46A_HUMAN	37.681	414	218	9	79	1254	22	417	2.44e-86	275
I asked in a GitHub issue what to do about this because I want to join the BLAST output with the DEG list for 2021 (listed below), but the files won’t have anything to join over, since the DEG list is genes (no .t# suffix).
So I’ll follow Sam’s advice:
Use existing BLAST output, but strip the .t1 from the first column and then sort for uniques just on the first column.
sed 's/\.t1//' blast_out_sep.tab | sort --unique -k1,1
This is probably fine, since it’s unlikely that multiple transcripts for a given gene would get annotated as a different protein.
Then, join with DEG list.
Fixed in the same R code file: paper-pycno-sswd-2021-2022/code/16-blast-genome-annotation.Rmd.
Here’s the new BLAST output:
head blast_out_sep_genes.tab
g10	sp	Q94A76	GORK_ARATH	42.667	75	40	1	31	255	537	608	8.11e-07	49.7
g100	sp	Q90WJ8	AJL2_ANGJA	29.861	144	92	4	70	474	20	163	3.68e-11	61.6
g1000	sp	Q6AY85	ALG14_RAT	53.846	182	81	1	130	666	35	216	1.86e-73	224
g10000	sp	Q8C163	EXOG_MOUSE	38.281	256	150	5	34	792	16	266	1.39e-52	178
g10002	sp	Q9D1J3	SARNP_MOUSE	37.113	97	54	1	286	576	101	190	1.33e-12	67.8
g10003	sp	Q4PJW3	CP51A_BOVIN	64.189	444	138	4	166	1443	60	500	0.0	604
g10004	sp	P48449	LSS_HUMAN	63.800	721	260	1	13	2175	8	727	0.0	984
g10005	sp	Q99996	AKAP9_HUMAN	36.364	418	191	10	1243	2463	3543	3896	6.97e-54	207
g10006	sp	Q70FJ1	AKAP9_MOUSE	29.651	688	378	19	8368	10404	1678	2268	1.69e-36	157
g10007	sp	Q6PB06	HYKK_XENLA	32.181	376	221	12	43	1140	12	363	4.38e-45	162
YAY!!!
Get Gene Ontology for BLAST Output
Following Steven’s class FISH 546 tutorial: here
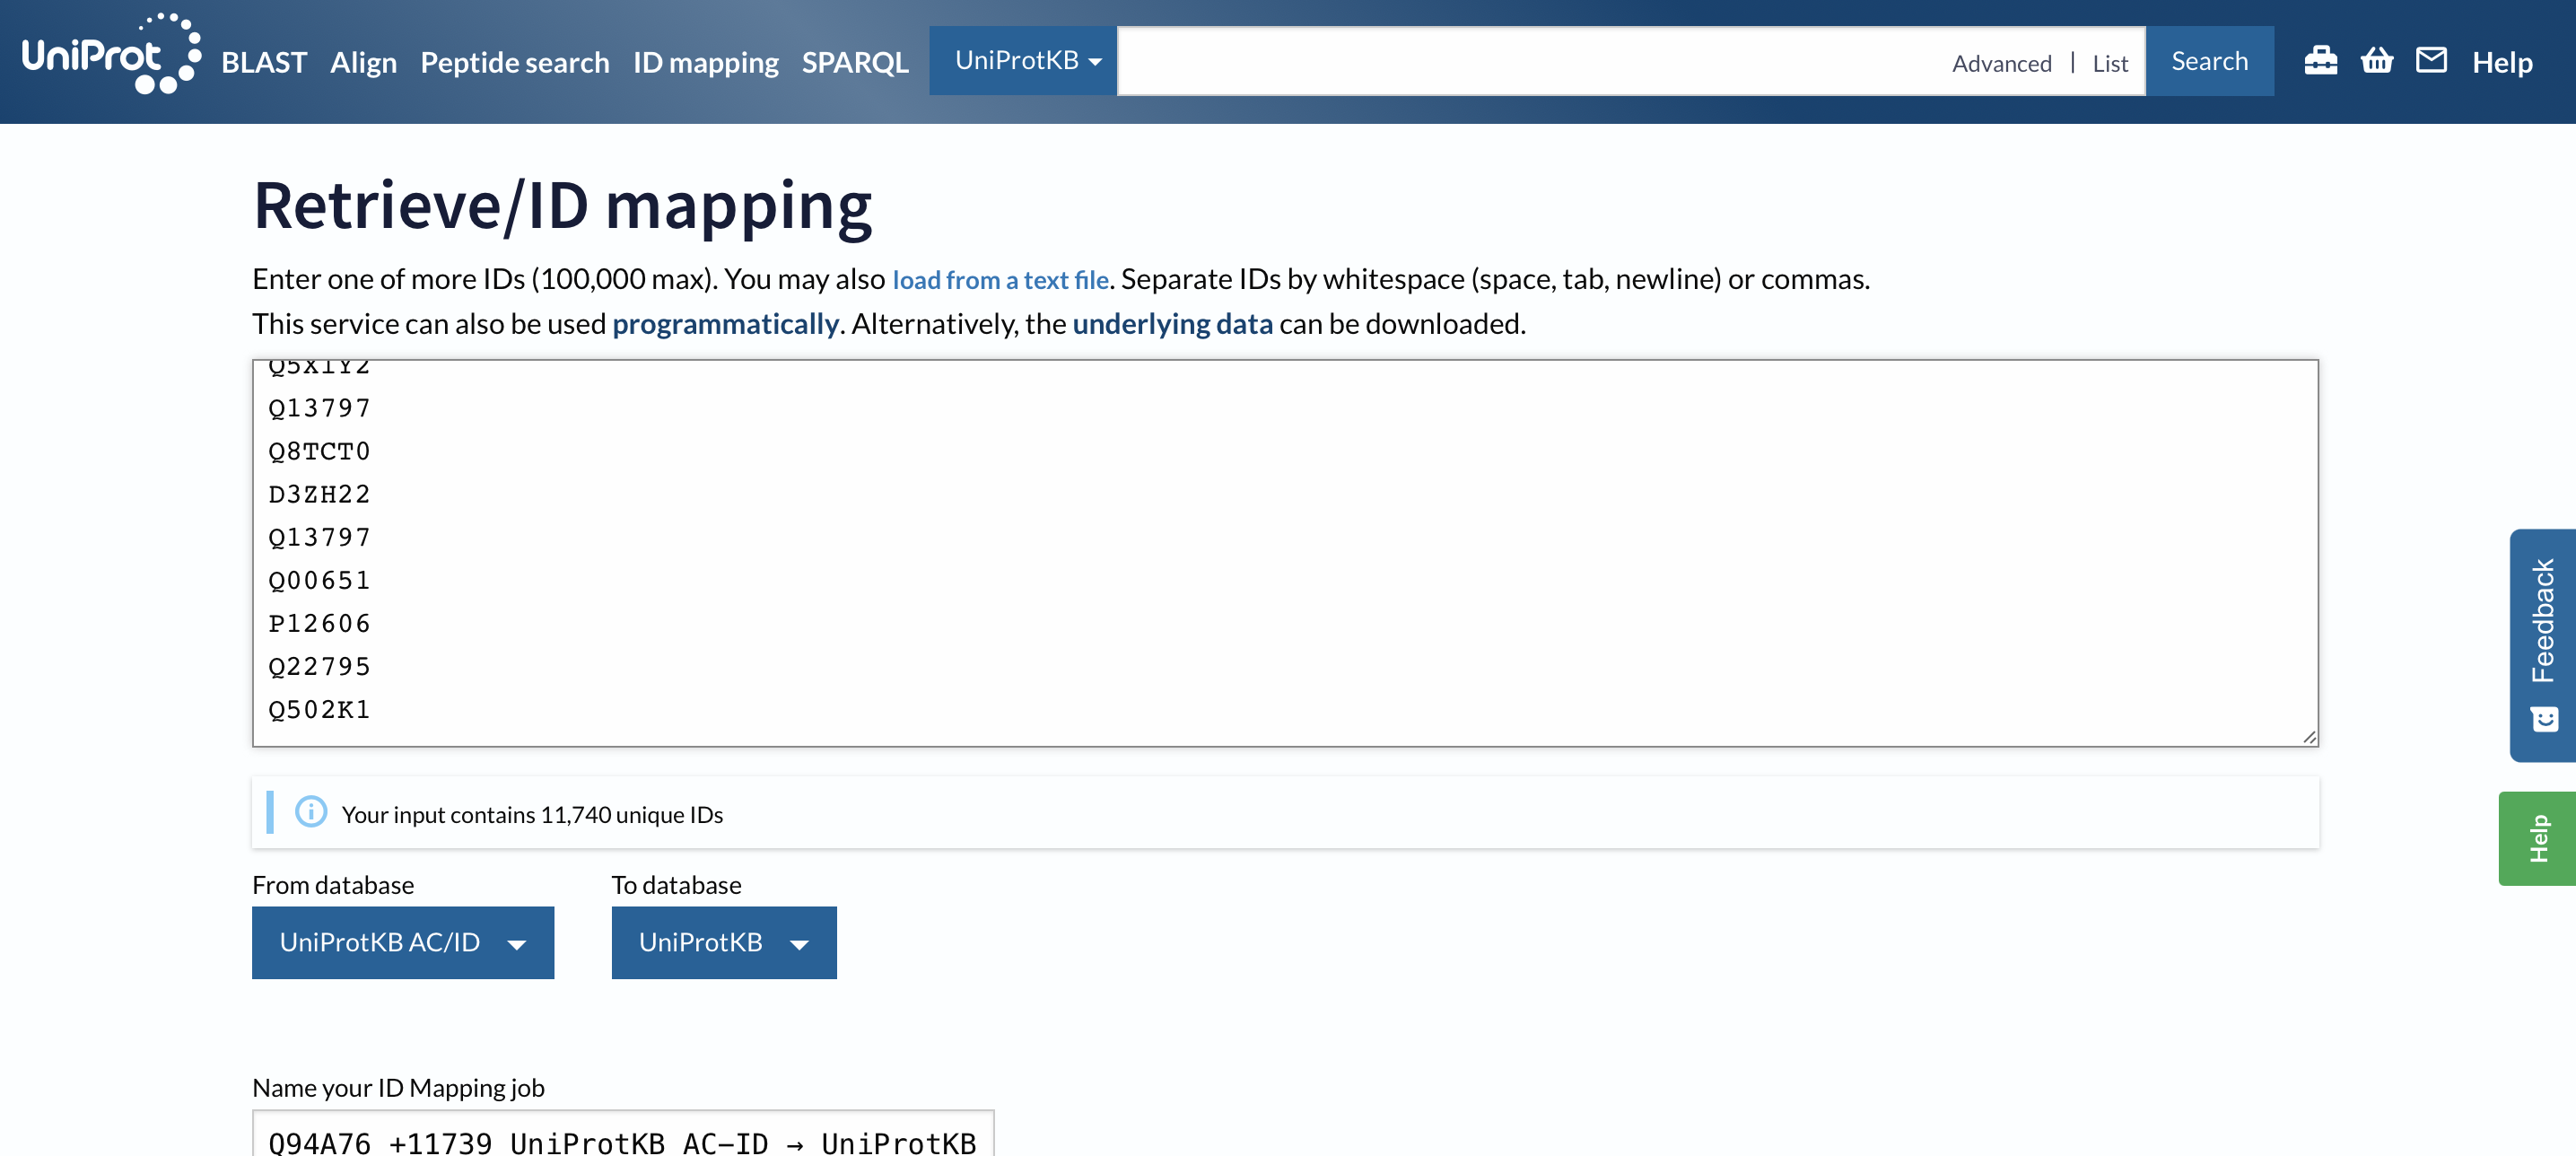
I used the uniprot.org ID Mapping feature to get the Gene Ontology annotations.
I opened the BLAST output above in excel locally, copied all the uniprot accession IDs, and pasted them in the ID Mapping tool:
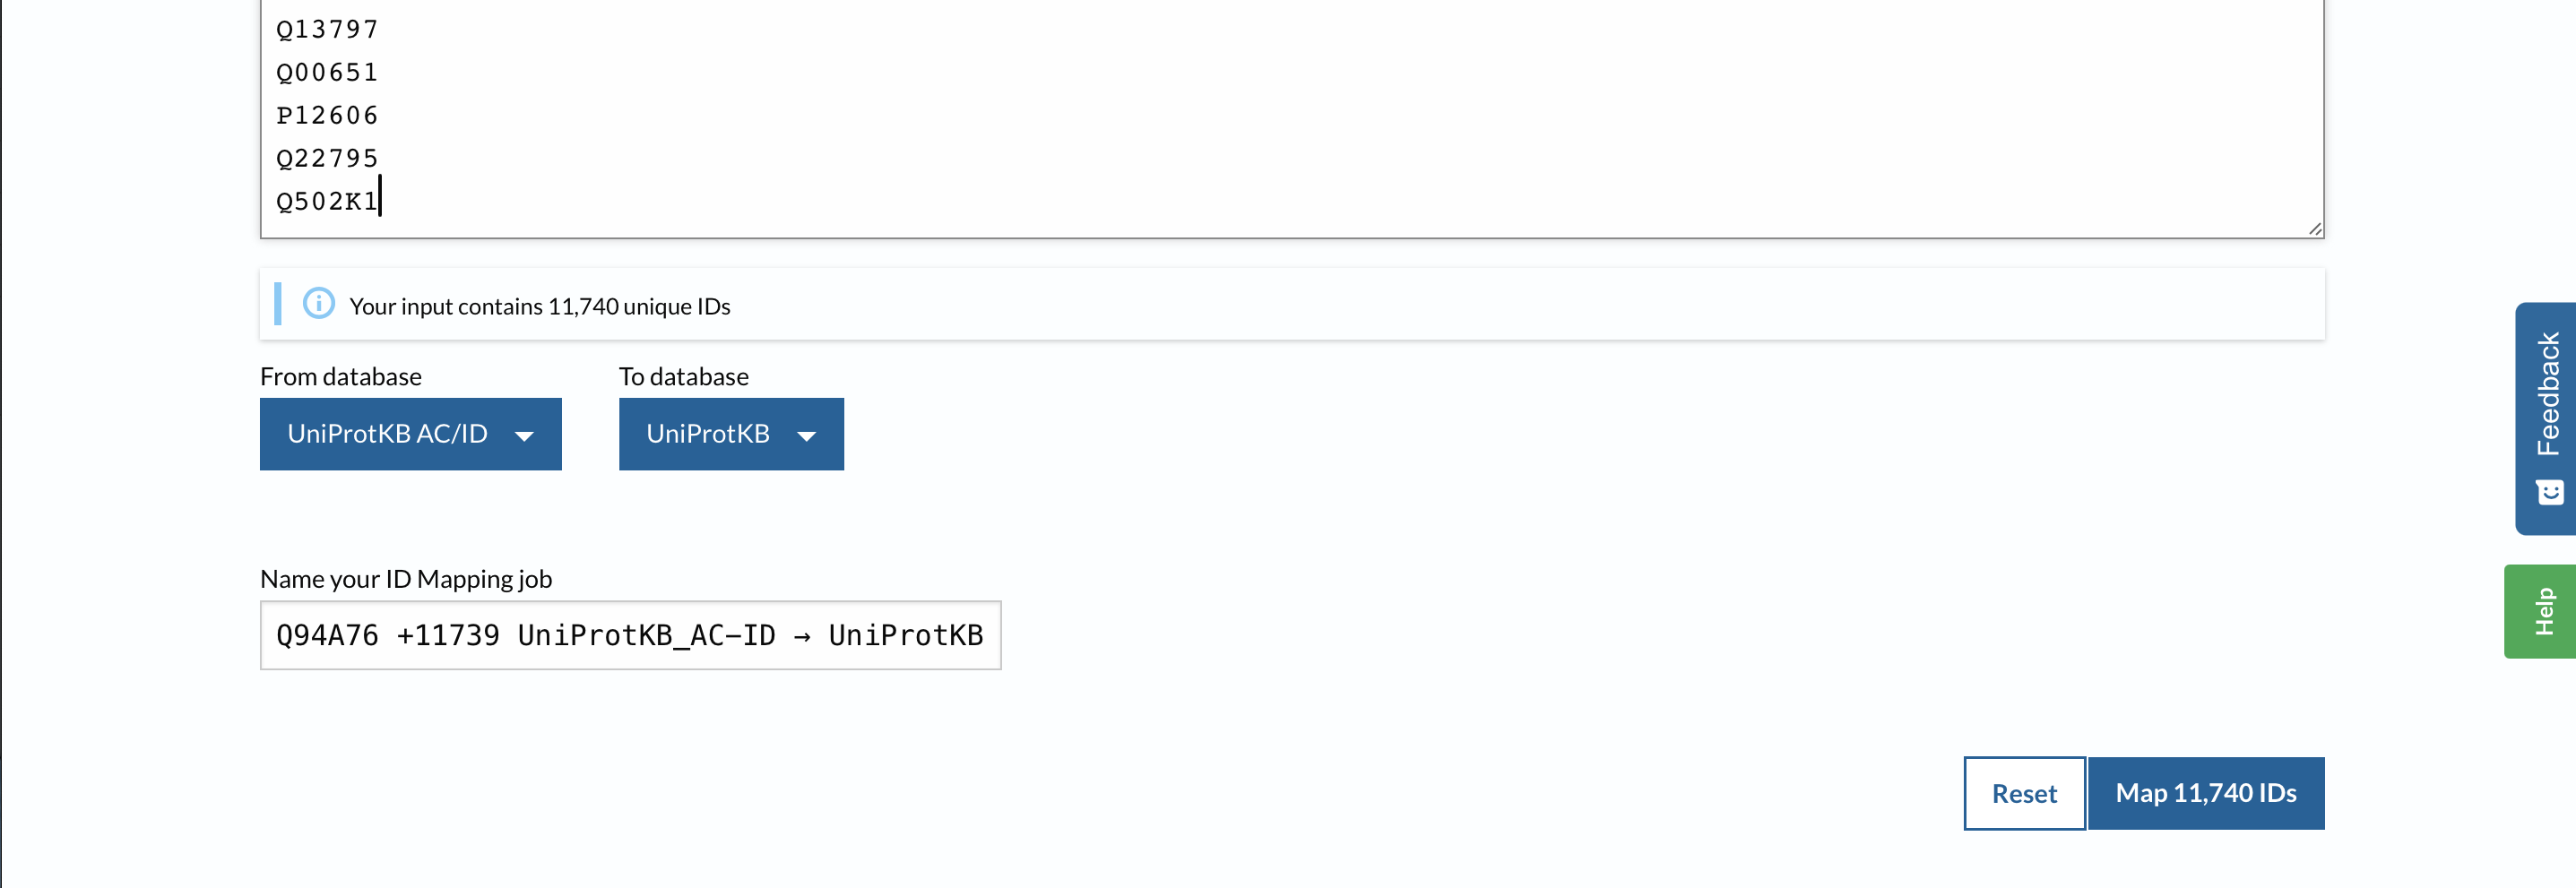
Select the start map button:
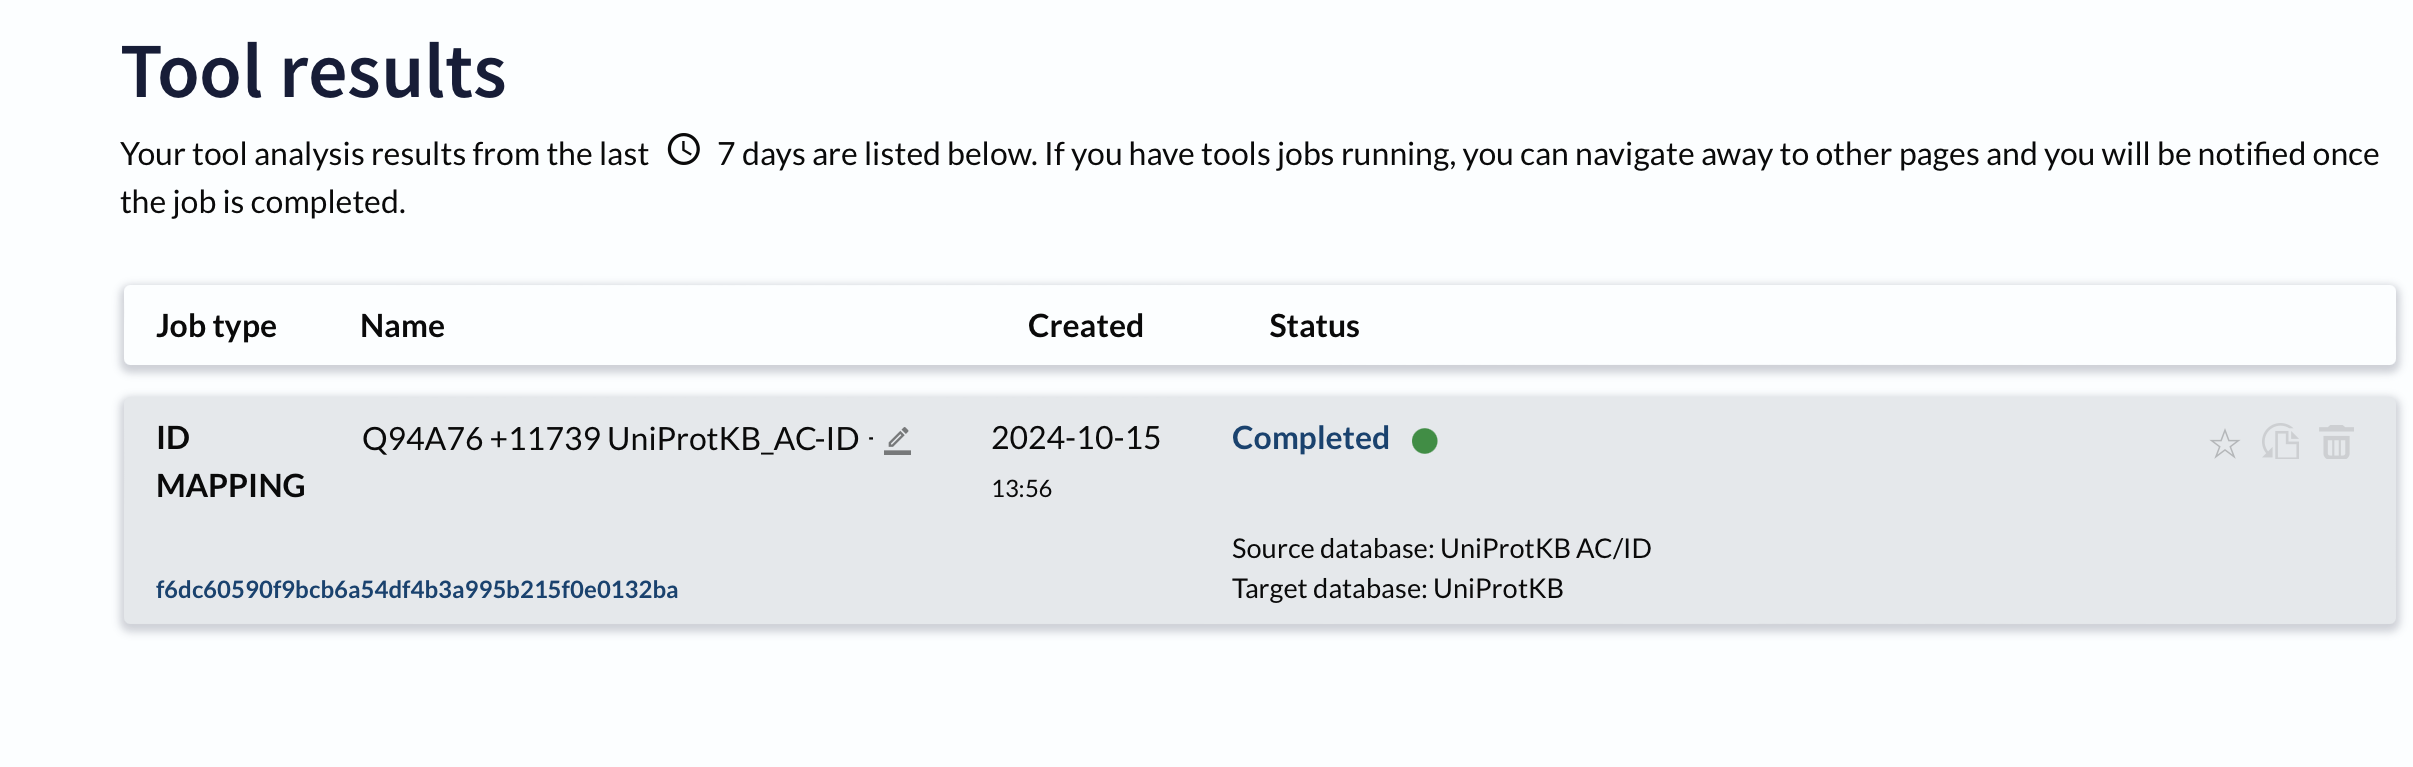
Mapping is complete, click on the word “complete”:
Select Customize Column option:
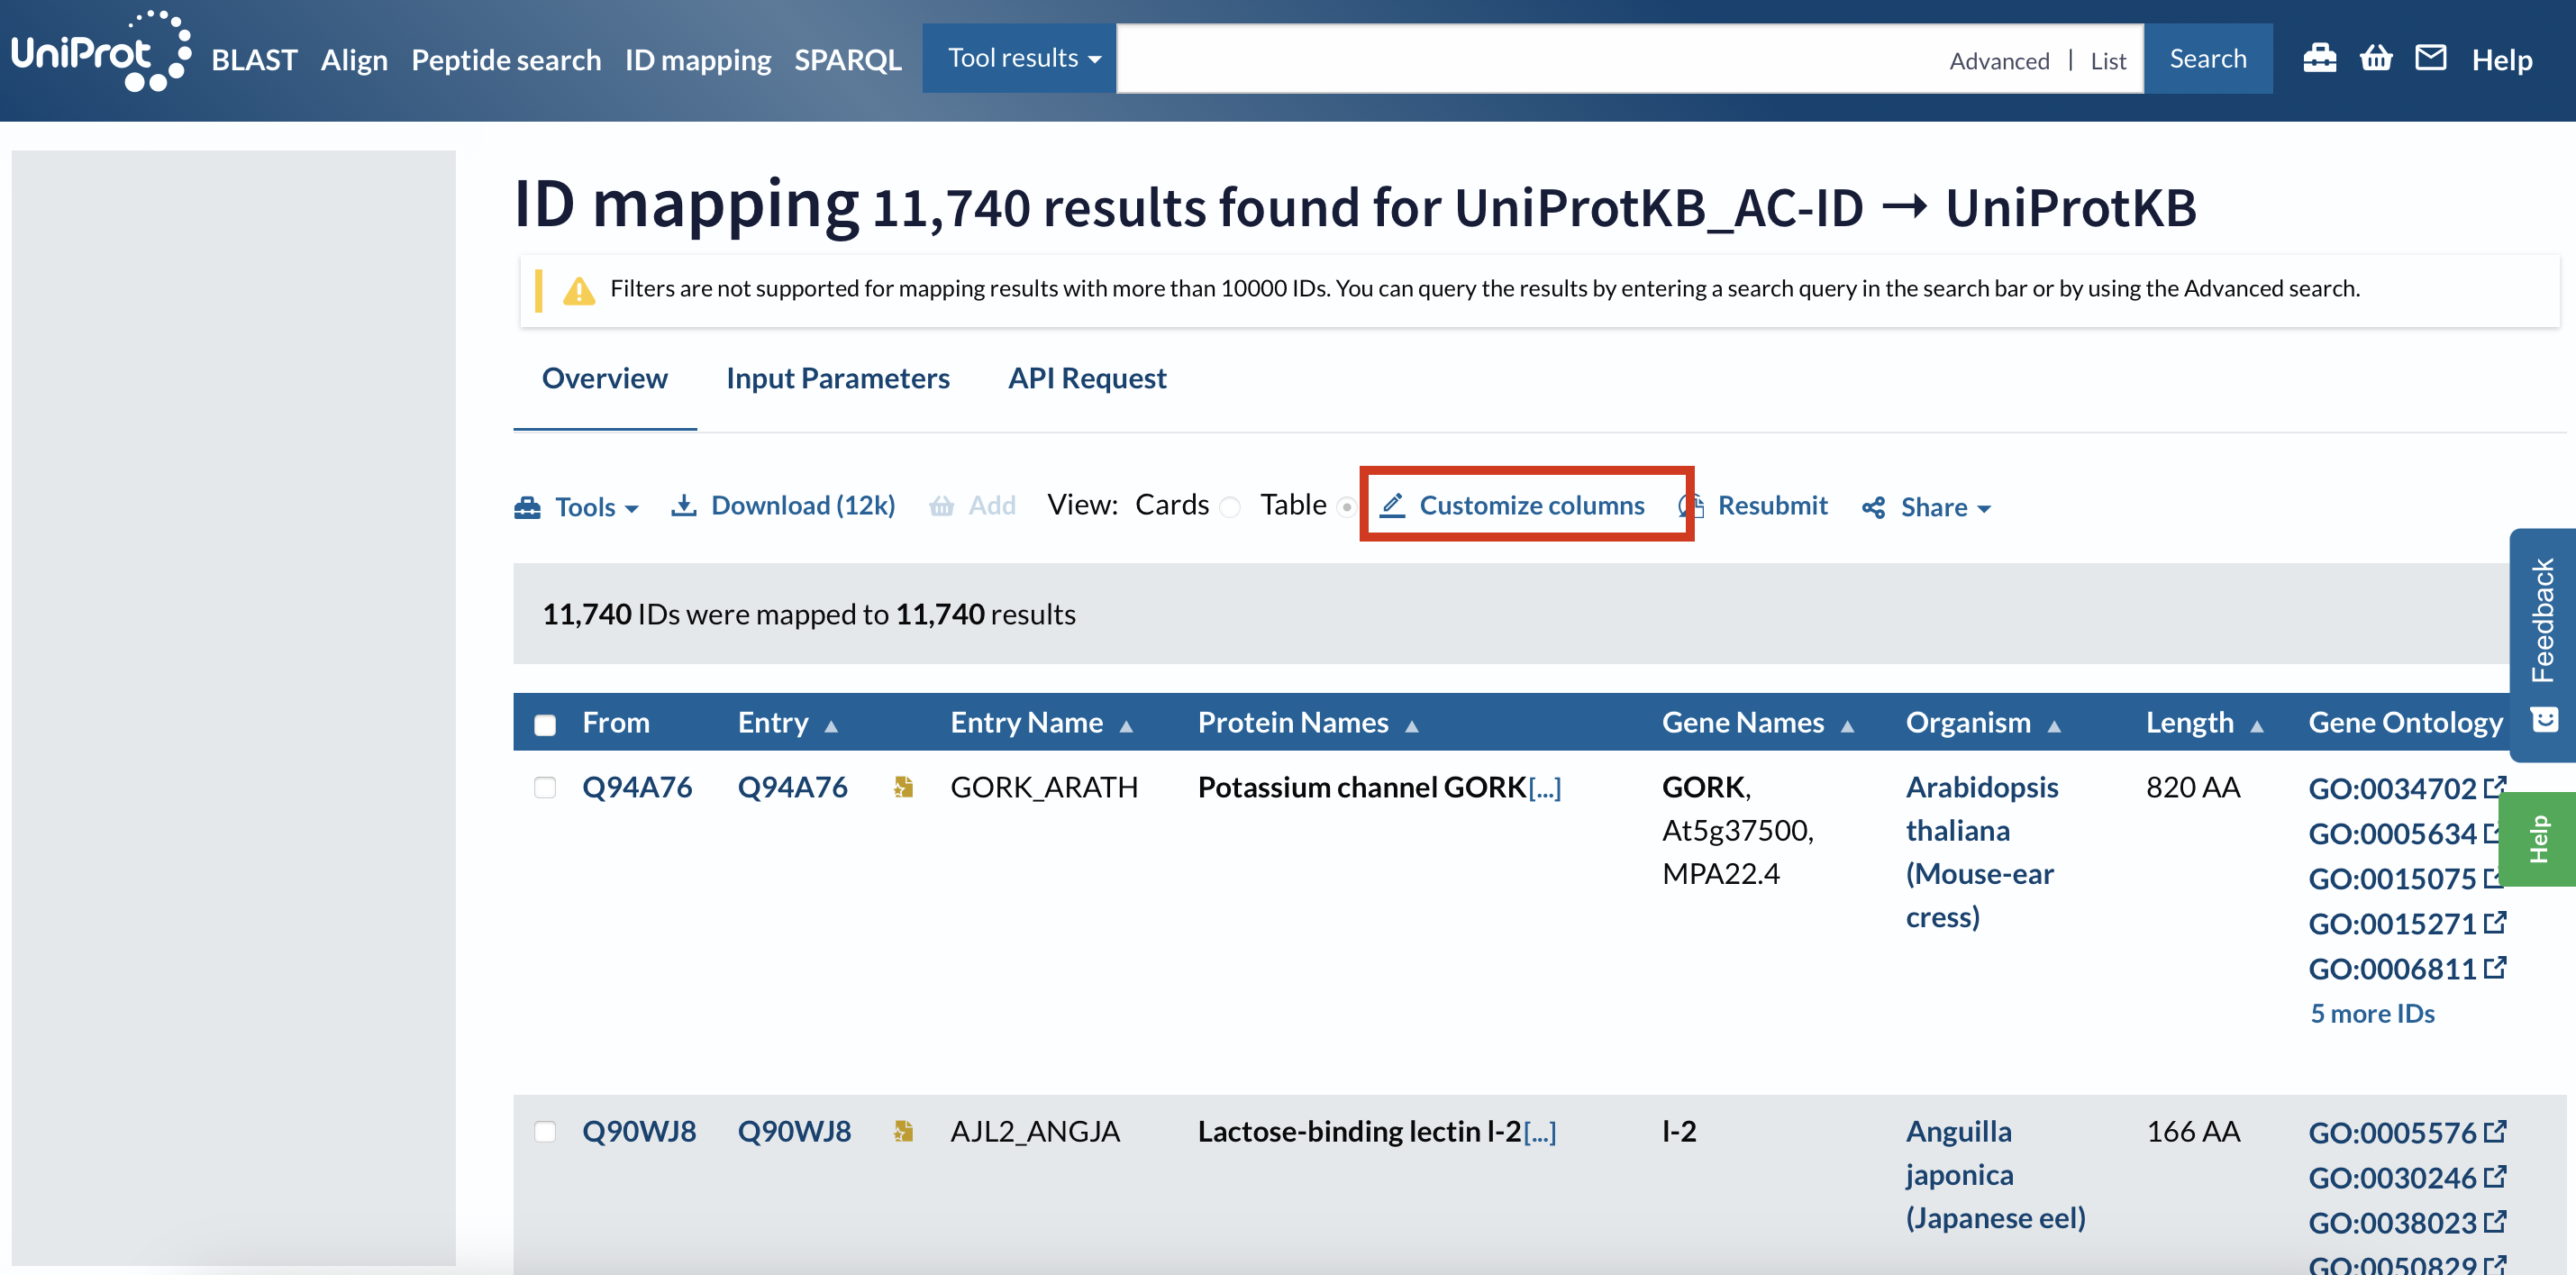
Select GO IDs:
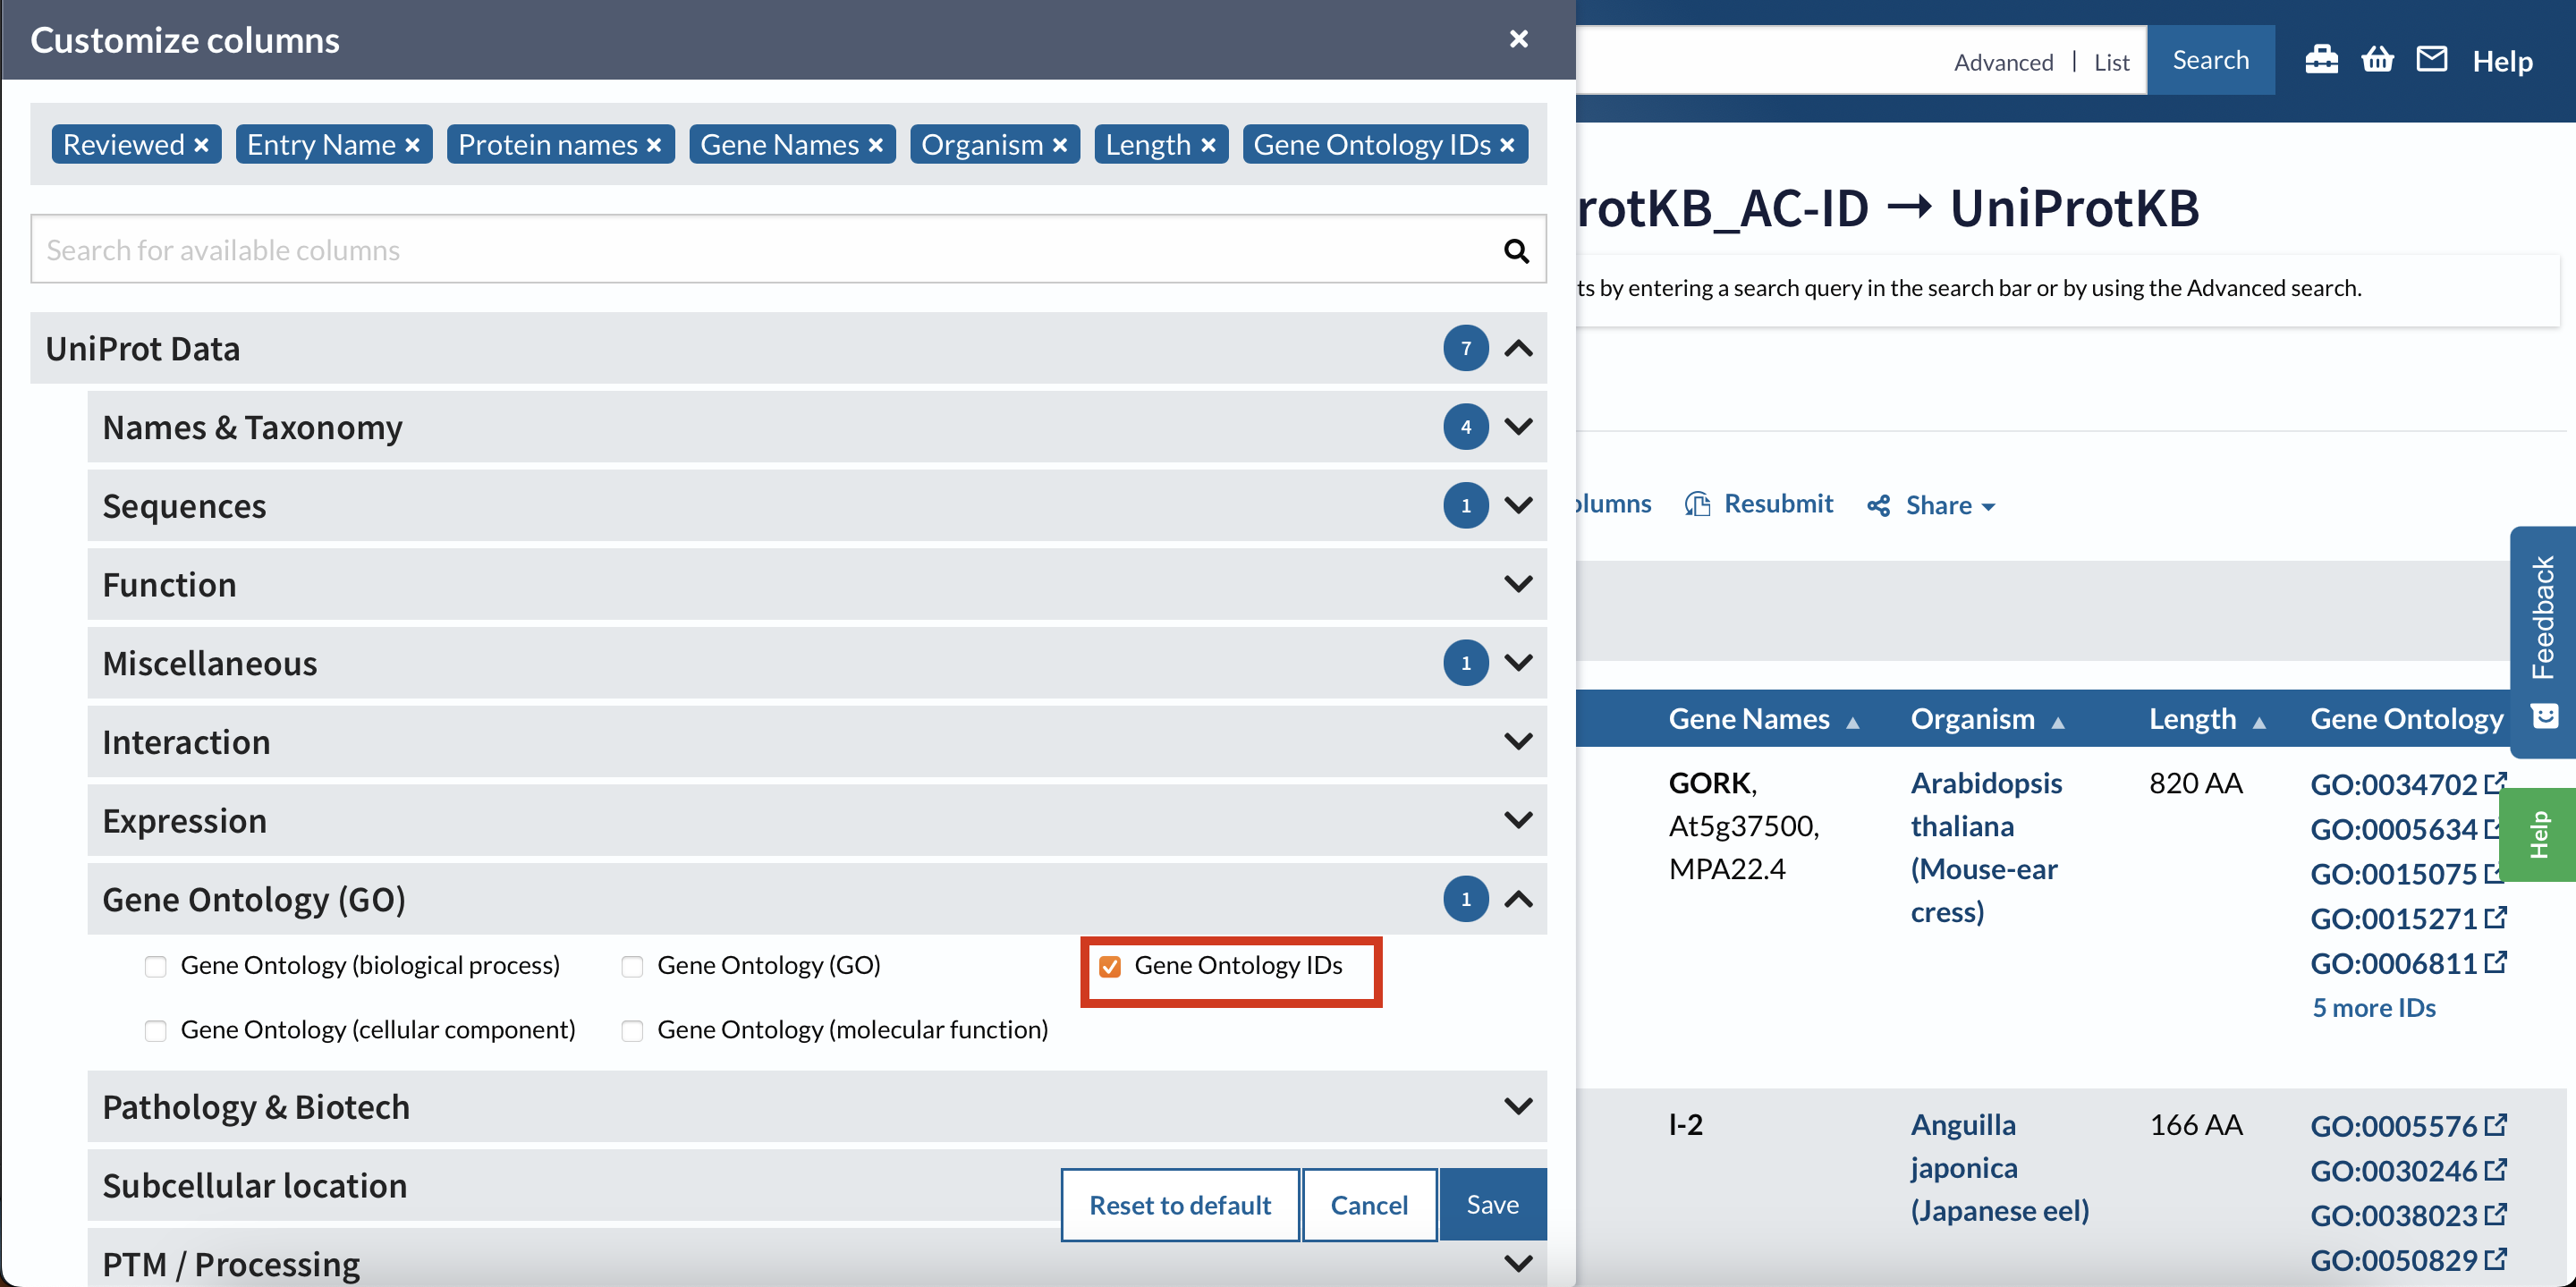
Then download the file as a .tsv.
Then copy and paste from downloads into paper-pycno-sswd-2021-2022/analyses/23-annotating-deg-lists. And push to GitHub.
2021 DEG list Annotation –> Enrichment
Summer 2021 DEG List Annotation
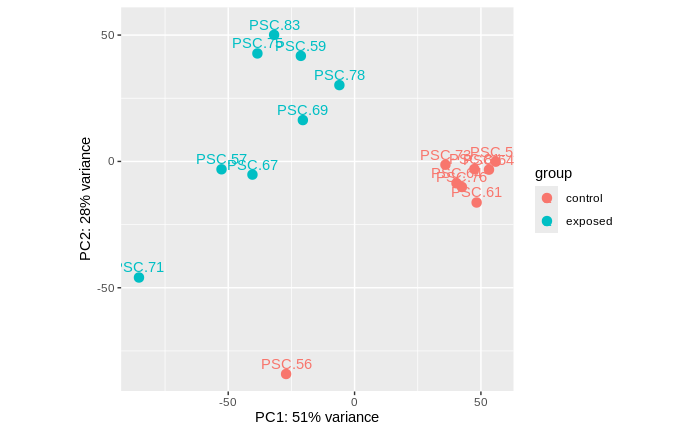
Ran DESeq2 to compare the 8 control star RNAseq libraries to the 8 exposed star RNAseq libraries. Got a list of DEGs (6,938), and annotated them by join-ing with the BLAST output from above.
Code using DESeq2: paper-pycno-sswd-2021-2022/code/21-deseq2-2021.Rmd
PCA of the libraries compared:
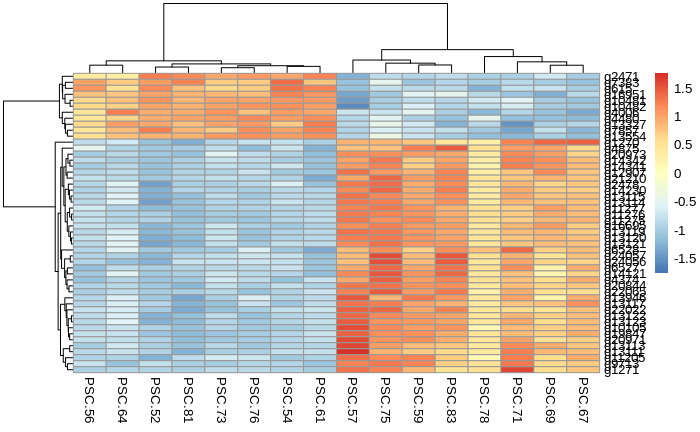
Heatmap of the top 50 DEGs from the comparison:
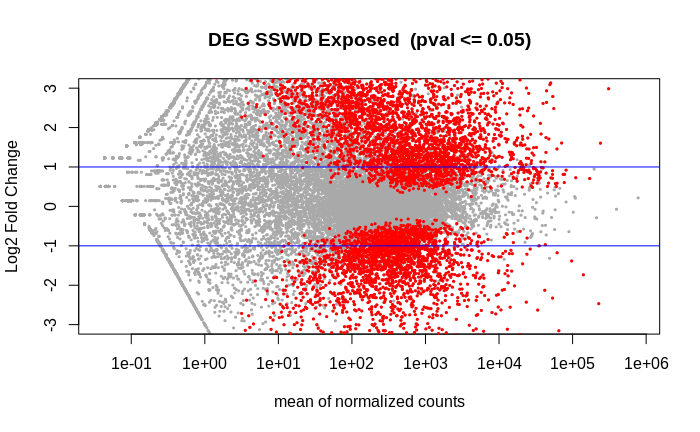
Volcano of the 6938 DEGs:
DEG list: paper-pycno-sswd-2021-2022/analyses/21-deseq2-2021/DEGlist_2021_exposedVcontrol.tab
head DEGlist_2021_exposedVcontrol.tab
baseMean	log2FoldChange	lfcSE	stat	pvalue	padj
g21712	15506.8006860189	-0.686001394104519	0.279769093821729	-2.45202707966608	0.0142053971059541	0.04104326062556
g21713	931.361342578574	0.765760120416294	0.279988740054853	2.73496755714631	0.00623864245462093	0.0207814457271467
g21711	12883.0935253533	-0.709970512692711	0.228673239474894	-3.10473807220743	0.00190447593029036	0.00763473087082639
g21769	95.2608451733162	3.6958184007692	1.00771829984027	3.66751144774787	0.000244922588350467	0.00136039062124746
g15181	7362.04249036577	2.13117880973538	0.606155663157497	3.5158935885115	0.000438276606665117	0.00222160900619904
g15182	848.103634775757	1.44107523921733	0.603474139884921	2.38796519017722	0.0169419463881676	0.047565397521059
g15183	916.675431757199	-0.700558231713056	0.24491415606803	-2.86042359886482	0.00423075479942892	0.0149434418878582
g7651	625.045813674949	1.17515444248357	0.338850532449784	3.46806137203791	0.000524227551336494	0.00257724022366272
g7656	369.553524158447	1.34279754324671	0.359840419468955	3.73164733752917	0.000190231694582979	0.00109975735292238
2,934 DEGs are more expressed in the controls (~42%)
4,004 DEGs are less expressed in the controls (~58%)
I got these numbers in excel… I averaged the counts for the genes in the controls (n=8 libraries), and averaged the counts for the genes for the exposed (n=8), and if the value was higher in the controls, a column was populated with “yes”, and if the value was less in controls compared to the exposed, the column was popuulated with “no”.
Annotate DEG list
Code to annotate DEG list: paper-pycno-sswd-2021-2022/code/23-annotating-deg-lists.Rmd
Annotated DEG list: paper-pycno-sswd-2021-2022/analyses/23-annotating-deg-lists/DEGlist_2021_exposedVcontrol_annotated.tab
head -3 DEGlist_2021_exposedVcontrol_annotated.tab
gene_id	baseMean	log2FoldChange	lfcSE	stat	pvalue	padj	PSC.56	PSC.52	PSC.54	PSC.61	PSC.64	PSC.73	PSC.76	PSC.81	PSC.59	PSC.57	PSC.69	PSC.67	PSC.71	PSC.75	PSC.78	PSC.83	Vuniprot_accession	gene_name	V5	V6	V7	V8	V9	V10	V11	V12	V13	V14	Entry	Reviewed	Entry.Name	Protein.names	Gene.Names	Organism	Length	Gene.Ontology.IDs
1	g21712	15506.8006860189	-0.686001394104519	0.279769093821729	-2.45202707966608	0.0142053971059541	0.04104326062556	16897	26645	32348	20860	32914	28245	21628	26422	10051	7784	7655	8444	8324	2531	22624	6679	sp	P54985	PPIA_BLAGE	73.171	164	44	0	1	492	1	164	2.17e-88	258	P54985	reviewed	PPIA_BLAGE	Peptidyl-prolyl cis-trans isomerase (PPIase) (EC 5.2.1.8) (Cyclophilin) (Cyclosporin A-binding protein) (Rotamase)	CYPA	Blattella germanica (German cockroach) (Blatta germanica)	164	GO:0003755; GO:0005737; GO:0006457; GO:0043231
2	g21713	931.361342578574	0.765760120416294	0.279988740054853	2.73496755714631	0.00623864245462093	0.0207814457271467	1025	718	596	910	905	905	1269	1044	1602	1167	479	2113	1073	128	584	1016	sp	Q8TDM6	DLG5_HUMAN	34.563	732	353	15	310	2409	158	795	1.74e-107	387	Q8TDM6	reviewed	DLG5_HUMAN	Disks large homolog 5 (Discs large protein P-dlg) (Placenta and prostate DLG)	DLG5 KIAA0583 PDLG	Homo sapiens (Human)	1919	GO:0001837; GO:0005737; GO:0005886; GO:0005912; GO:0007165; GO:0008013; GO:0008092; GO:0008285; GO:0014069; GO:0030011; GO:0030054; GO:0030159; GO:0030336; GO:0030859; GO:0030901; GO:0035331; GO:0035332; GO:0035556; GO:0036064; GO:0042130; GO:0042981; GO:0045176; GO:0045186; GO:0045197; GO:0045880; GO:0051965; GO:0060441; GO:0060563; GO:0060999; GO:0065003; GO:0071896; GO:0072205; GO:0098609; GO:0098978; GO:0099173
Summer 2021 Enrichment
Using DAVID and REVIGO.
R code to get lists for DAVID: paper-pycno-sswd-2021-2022/code/24-2021-2022-enrichment.Rmd
DAVID
Background (genome BLAST uniprot accession IDs):
paper-pycno-sswd-2021-2022/analyses/24-2021-2022-enrichment/blast_uniprotAccession_forDAVID.txt
Gene Ontology Biological Processes results:
DAVID output:
paper-pycno-sswd-2021-2022/analyses/24-2021-2022-enrichment/DAVID_2021_DEGlist.txt
I’m not sure what the best metric is for looking at enrichment from DAVID.
Kegg Pathway list:
paper-pycno-sswd-2021-2022/analyses/24-2021-2022-enrichment/DAVID_2021_KEGG_pathway.txt
I found this youtube video on how to use DAVID, that basically confirms that I’ll be using the GOTERM_BP_DIRECT list (which is what’s linked above), and the KEGG pathways. I’m not totally sure which metric is best for identifying the most enriched processes - whether that be Bonferroni, FDR, p-value, etc. So I’ll look into that this week.

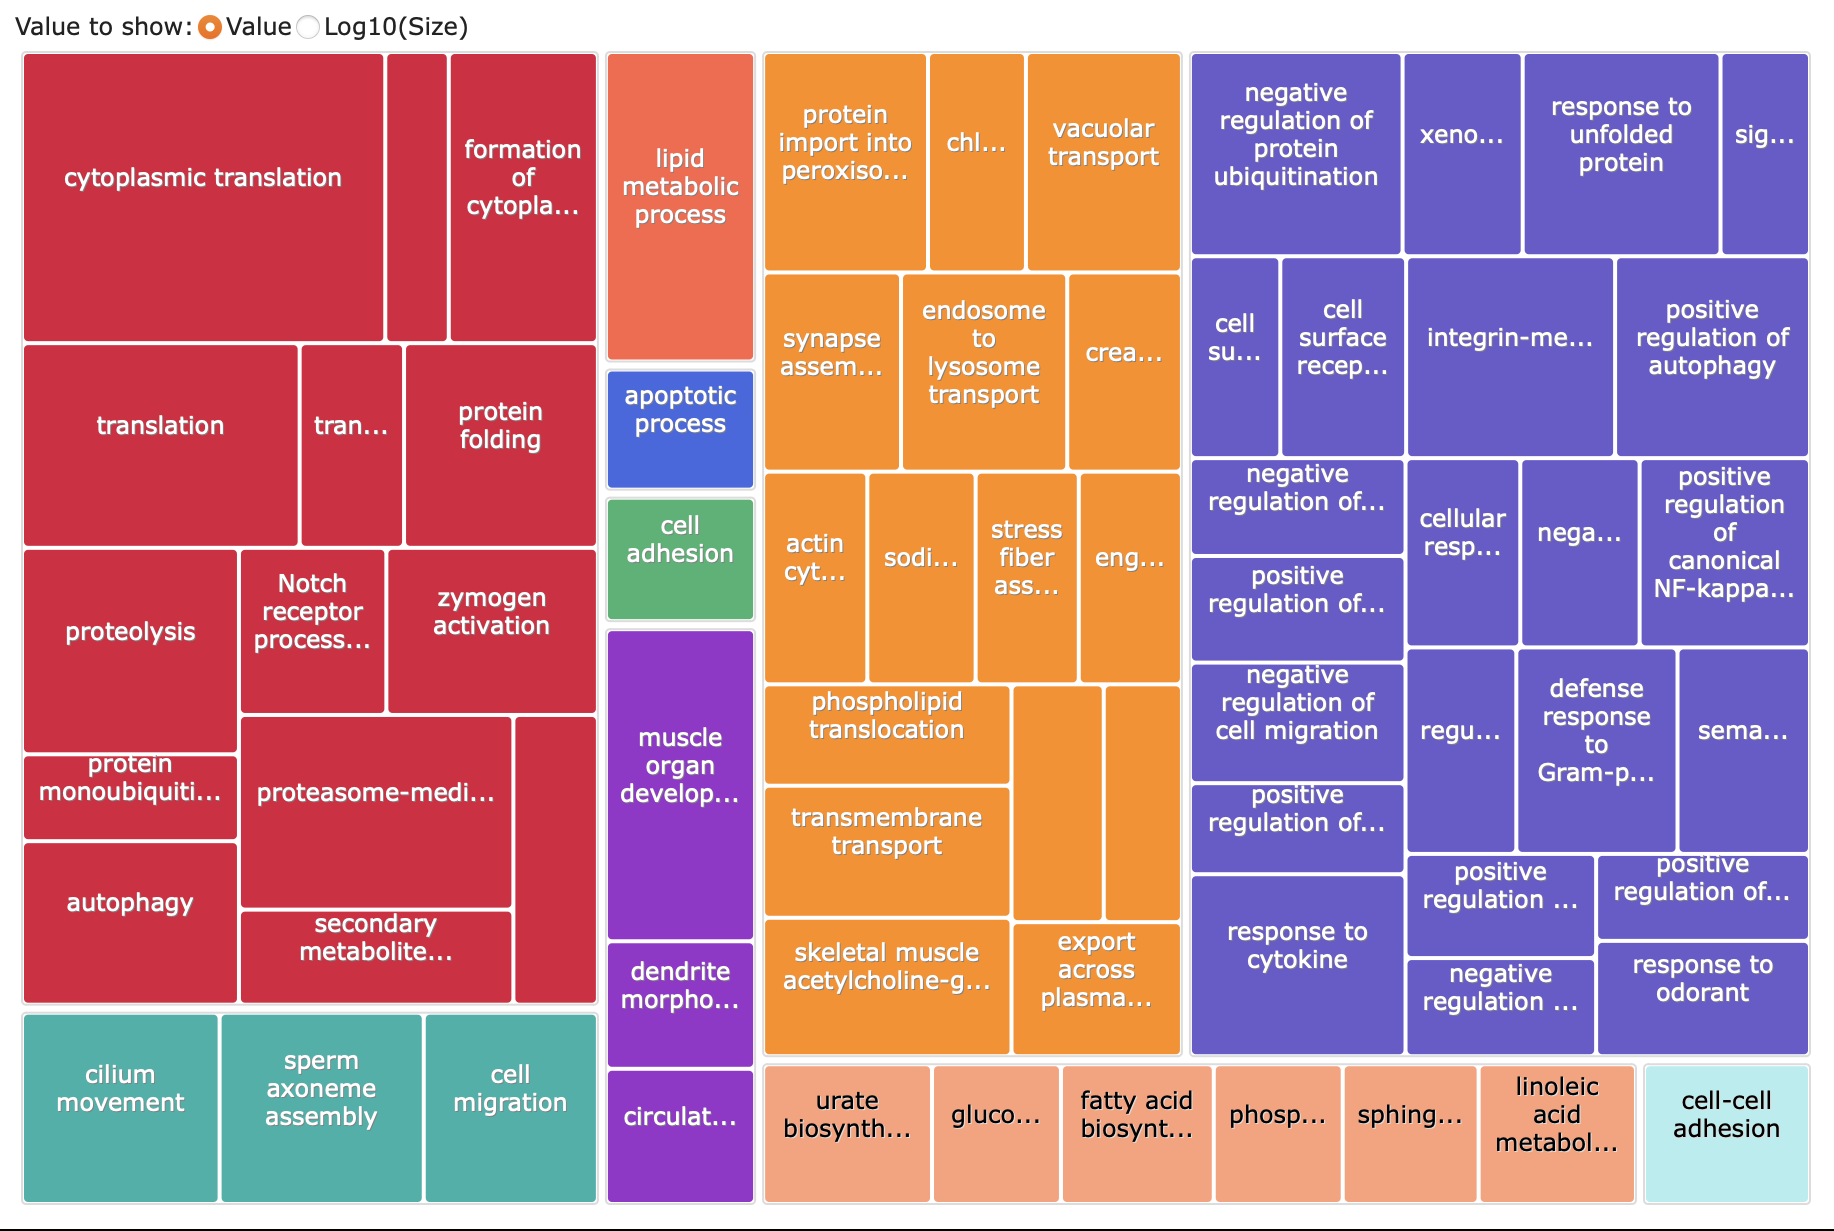
REVIGO
Here’s what I put into REVIGO: paper-pycno-sswd-2021-2022/analyses/24-2021-2022-enrichment/2021_GO_pvalue_for_REVIGO.txt
It’s the GO terms from the DAVID output for the terms that had a p-value < 0.05.
Here’s the treemap of that analysis:
Finding Cool Genes
What I can do from here, is look at the GO IDs from the enriched terms in paper-pycno-sswd-2021-2022/analyses/24-2021-2022-enrichment/2021_GO_pvalue_for_REVIGO.txt, and then find that GO ID in the 2021 annotated DEG list, and find the genes associated with that term. There are going to be multiple/many genes associated with each GO ID, so I’ll pick the ones that are related to stress/imumune response.
I can then look at the counts of that gene across the libraries and see if it’s more expressed in controls vs exposed. I can also create a visual of those counts across samples with a heatmap.
Short-term Goals
Get analyses for 2021 and 2022 solidly done by Friday end of day.
This means:
2021
- DEG list annotation (DONE)
- Enrichment DAVID output (DONE)
- REvigo images
- Genes of interest highlighted
- Papers related to genes of interest compiled
2022
- DEG lists annotated
- Lists: - control vs exposed - control vs exposed with age into account - age contrast (just DEGs influenced by age that are related to control vs exposed)
- Enrichment DAVID outputs
- Revigo images
- Genes of interest highlighted
- Papers related to genes of interest compiled