Taking 2022 gene count matrix through DESeq2 to enrichment with DAVID and revigo. Also, compared 2021 control vs exposed DEG list to the 2022 control vs exposed DEG list through to Revigo.
Notes
Some notes before getting into the details.
Something I’m unsure of is which result metric from DAVID to use to identify significantly enriched biological processes. Here’s the documentation from the DAVID webpage: https://david.ncifcrf.gov/content.jsp?file=functional_annotation.html#bonfer
2022 DEG lists Annotation –> Enrichment
R Code for DESeq2: paper-pycno-sswd-2021-2022/code/22-deseq2-2022.Rmd
R Code for Annotation: paper-pycno-sswd-2021-2022/code/23-annotating-deg-lists.Rmd
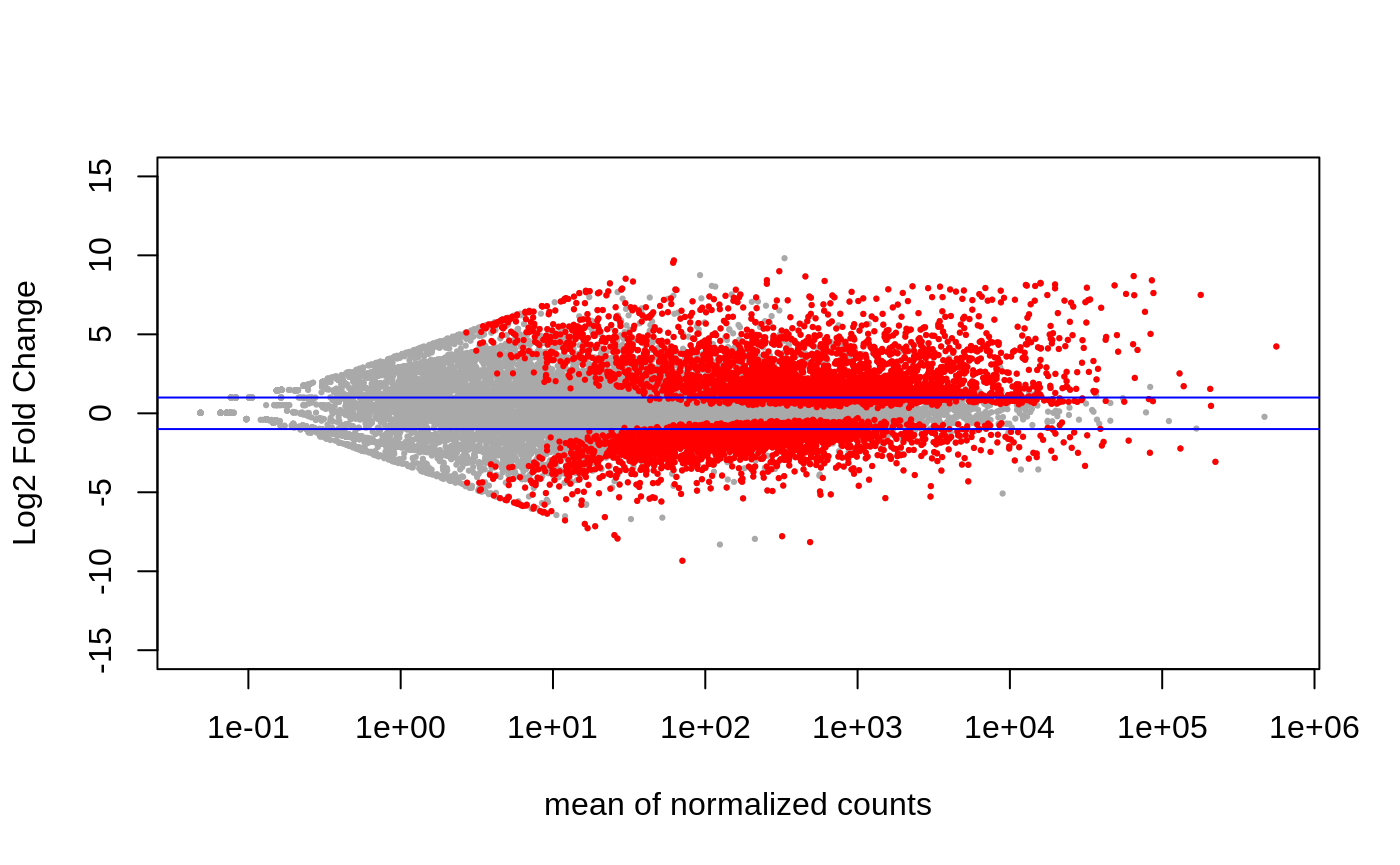
Control 6 vs exposed 6
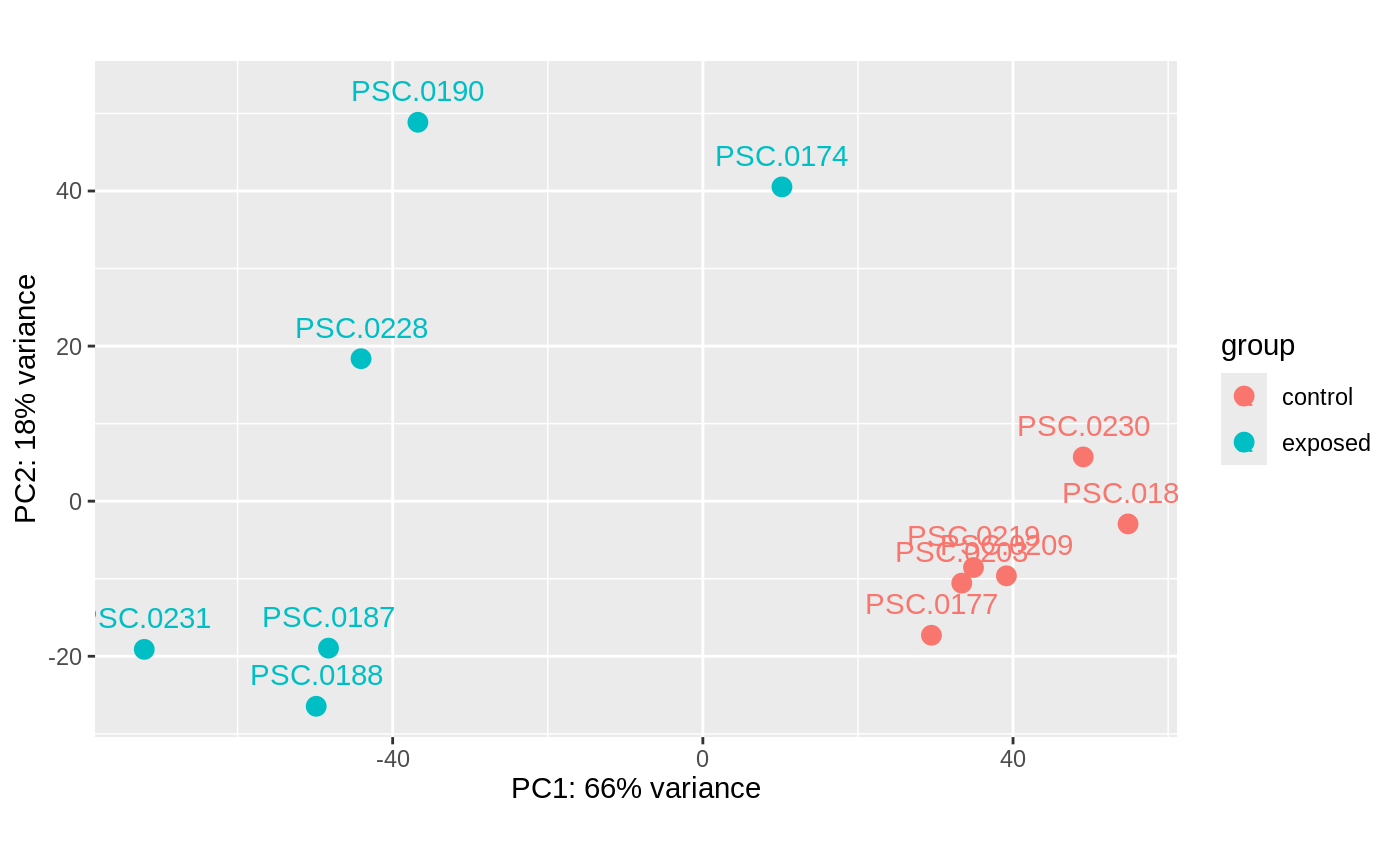
6 controls (3 adults and 3 juveniles) vs 6 exposed (3 adults and 3 juveniles).
DEG list: paper-pycno-sswd-2021-2022/analyses/22-deseq2-2022/DEGlist_2022_controlVexposed.tab
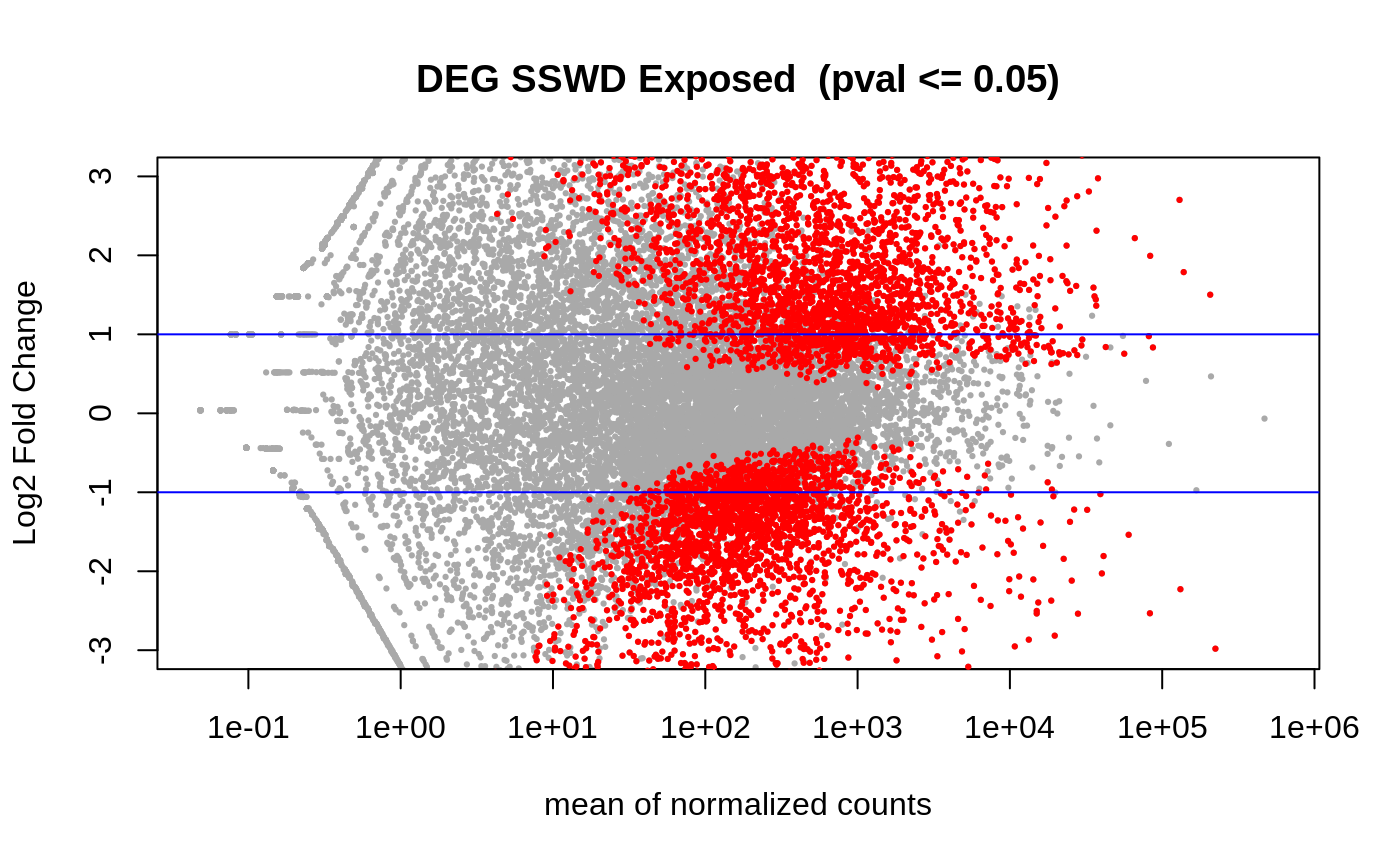
6,237 DEGs.
PCA:
Volcano:
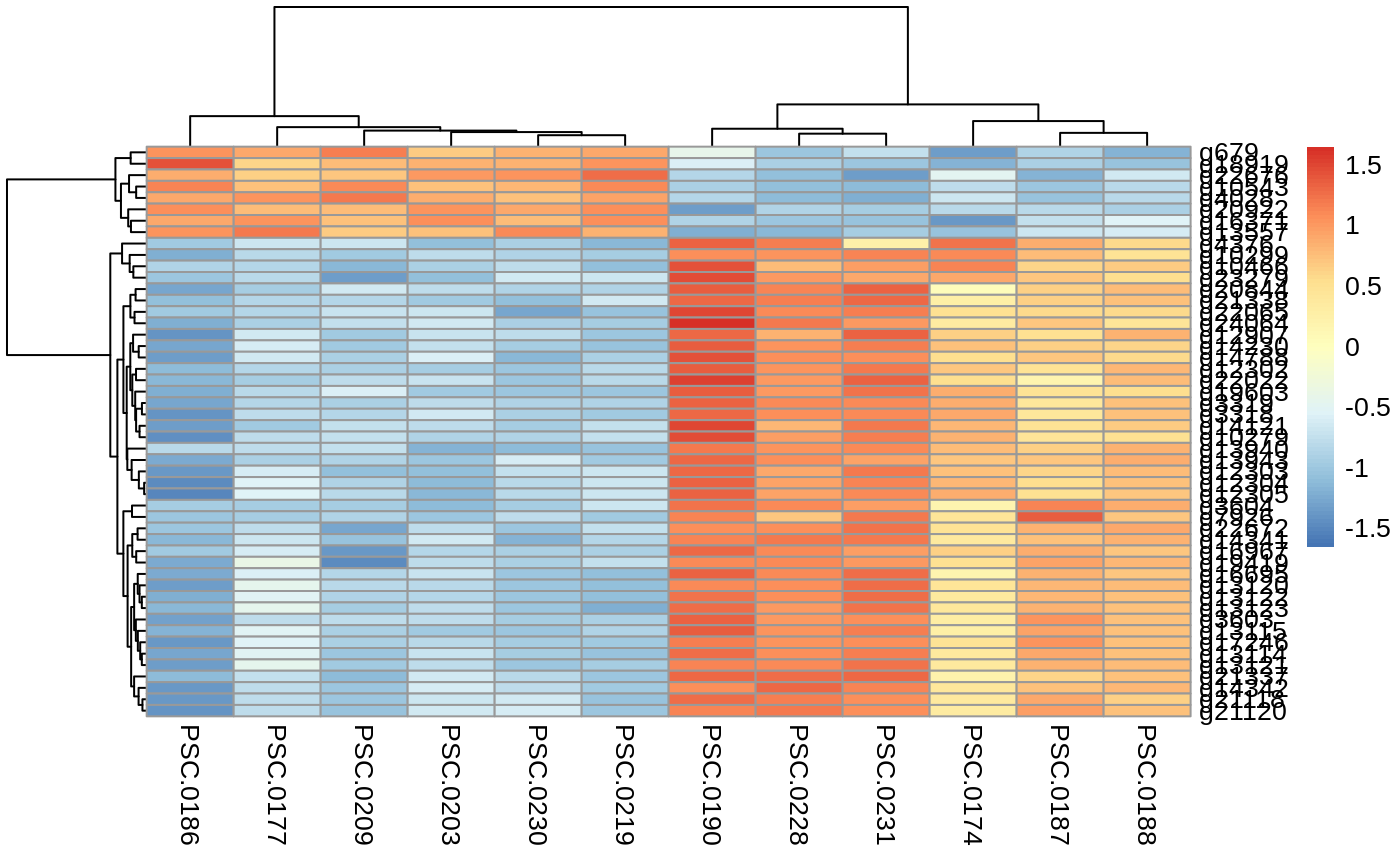
Heatmap of top 50 DEGs:
Annotation
DEG annotated list: paper-pycno-sswd-2021-2022/analyses/23-annotating-deg-lists/DEGlist_2022_exposedVcontrol_annotated.tab
Enrichment
DAVID output (with genome blast uniprot accession IDs as background):
paper-pycno-sswd-2021-2022/analyses/24-2021-2022-enrichment/DAVID-2022-controlVexposed.txt
Here’s the significantly enriched processes:
Are they most significant?? I did it based on Bonferroni/Fold Enrichment.
| Term | Count | % | PValue | List Total | Pop Hits | Pop Total | Fold Enrichment | Bonferroni | Benjamini | FDR |
|---|---|---|---|---|---|---|---|---|---|---|
| GO:0006511~ubiquitin-dependent protein catabolic process | 94 | 2.14758967 | 4.19E-08 | 4107 | 156 | 10742 | 1.57602717 | 2.97E-04 | 2.29E-04 | 2.29E-04 |
| GO:0016567~protein ubiquitination | 167 | 3.81539867 | 6.47E-08 | 4107 | 314 | 10742 | 1.3910645 | 4.58E-04 | 2.29E-04 | 2.29E-04 |
| GO:0002181~cytoplasmic translation | 32 | 0.73109436 | 4.64E-07 | 4107 | 40 | 10742 | 2.09242756 | 0.00328165 | 9.83E-04 | 9.82E-04 |
| GO:0006508~proteolysis | 194 | 4.43225954 | 5.55E-07 | 4107 | 383 | 10742 | 1.32483991 | 0.00392559 | 9.83E-04 | 9.82E-04 |
REVIGO
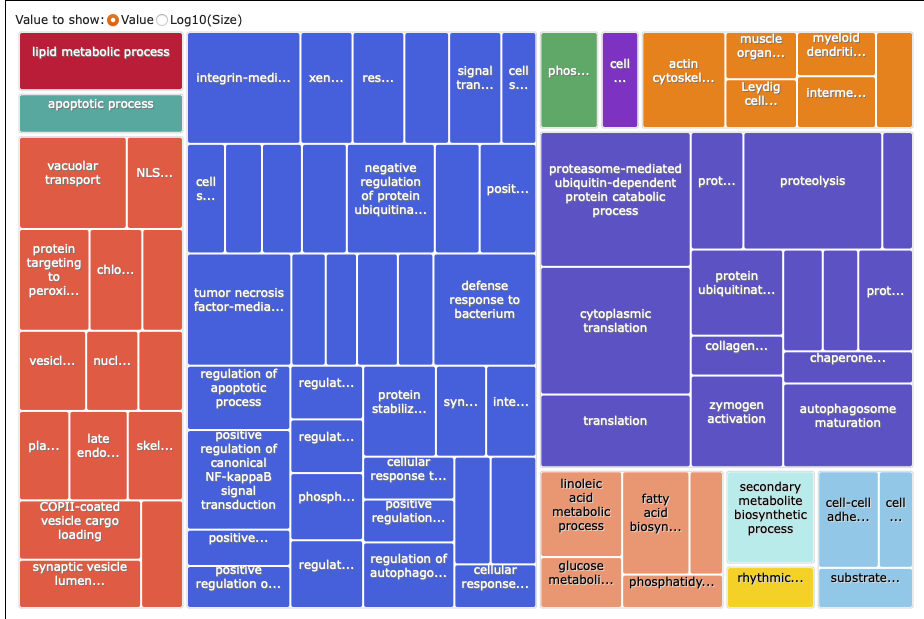
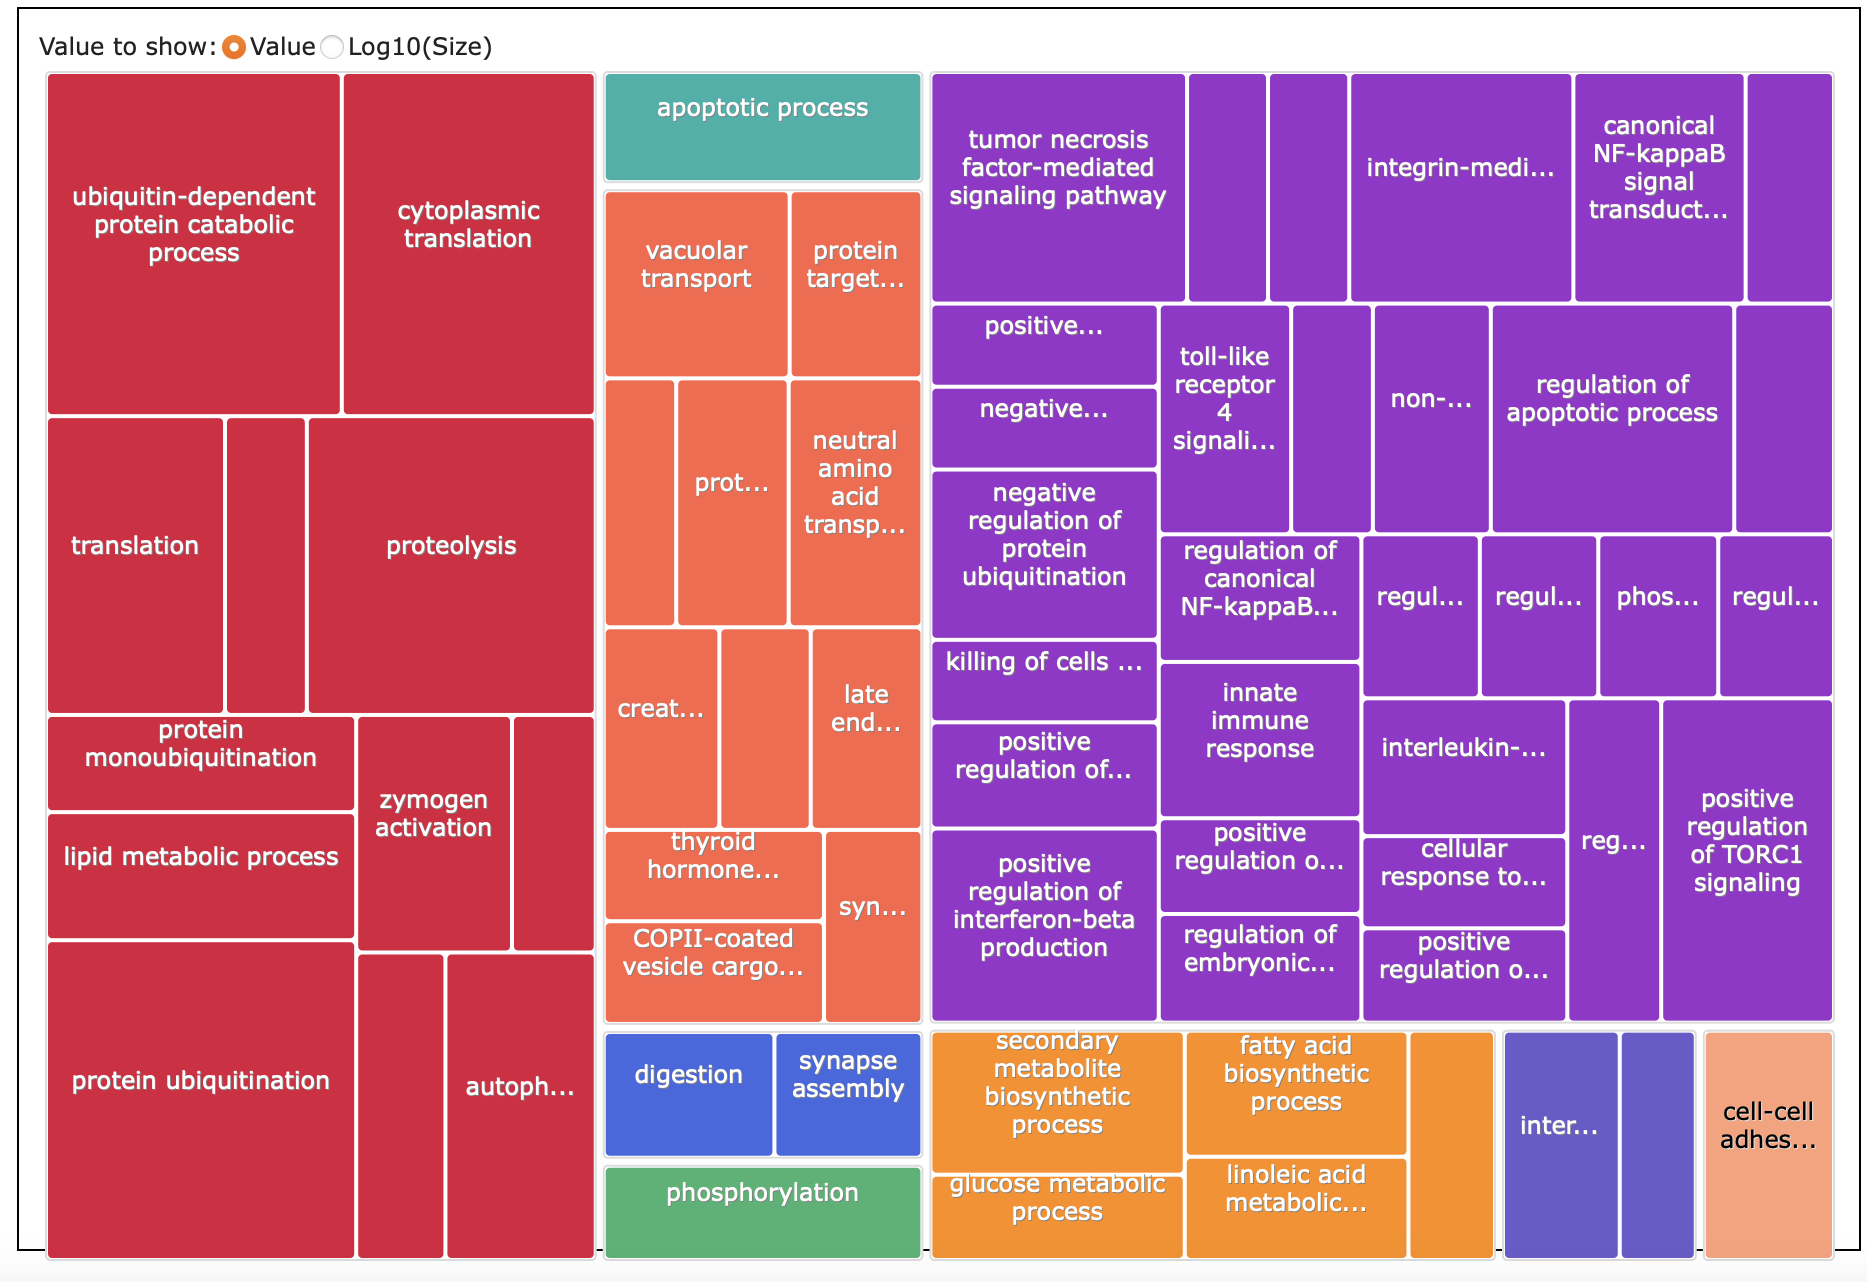
Here’s what I put into REVIGO: paper-pycno-sswd-2021-2022/analyses/24-2021-2022-enrichment/2022-controlVexposed-forREVIGO.txt. GO terms and p-values for those with p-value <0.05. 89 terms.
Treemap list:
paper-pycno-sswd-2021-2022/analyses/24-2021-2022-enrichment/2022-controlVexposed_Revigo_BP_TreeMap.tsv
Treemap:
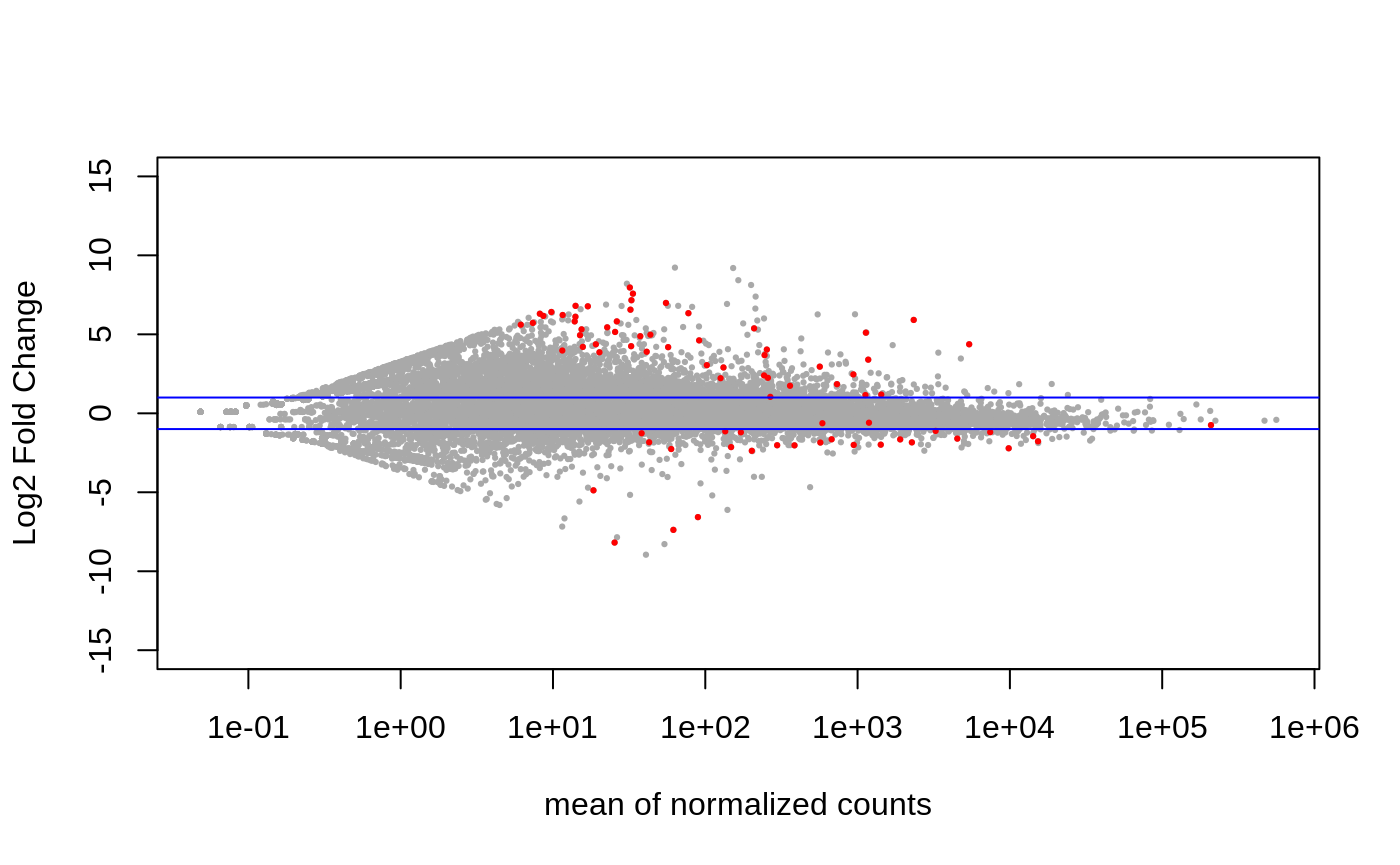
Control vs Exposed taking Age into account
Control Adults (n=3)
Control Juveniles (n=3)
Exposed Adults (n=3)
Exposed Juveniles (n=3)
DEG list: paper-pycno-sswd-2021-2022/analyses/22-deseq2-2022/DEGlist_2022_controlVexposed_withAge.tab
6,202 DEGs.
Annotation
DEG annotated list: paper-pycno-sswd-2021-2022/analyses/23-annotating-deg-lists/DEGlist_2022_exposedVcontrol_withAge_annotated.tab
Enrichment
DAVID output with genome blast uniprot accession IDs as background):
paper-pycno-sswd-2021-2022/analyses/24-2021-2022-enrichment/DAVID-2022-controlVexposed-withage.txt
Here’s the significantly enriched processes:
Are they most significant?? I did it based on Bonferroni/Fold Enrichment.
| Term | Count | % | PValue | List Total | Pop Hits | Pop Total | Fold Enrichment | Bonferroni | Benjamini | FDR |
|---|---|---|---|---|---|---|---|---|---|---|
| GO:0002181~cytoplasmic translation | 34 | 0.77237619 | 1.40E-08 | 4137 | 40 | 10742 | 2.20708243 | 9.96E-05 | 9.96E-05 | 9.96E-05 |
| GO:0006511~ubiquitin-dependent protein catabolic process | 93 | 2.11267606 | 1.51E-07 | 4137 | 156 | 10742 | 1.54795374 | 0.00106954 | 4.98E-04 | 4.98E-04 |
| GO:0016567~protein ubiquitination | 166 | 3.77101318 | 2.10E-07 | 4137 | 314 | 10742 | 1.37270769 | 0.00149374 | 4.98E-04 | 4.98E-04 |
| GO:0006508~proteolysis | 193 | 4.38437074 | 1.66E-06 | 4137 | 383 | 10742 | 1.30845311 | 0.01172974 | 0.00294977 | 0.00294811 |
| GO:0006412~translation | 100 | 2.27169468 | 1.56E-05 | 4137 | 184 | 10742 | 1.41117802 | 0.10520751 | 0.02223252 | 0.02222001 |
REVIGO
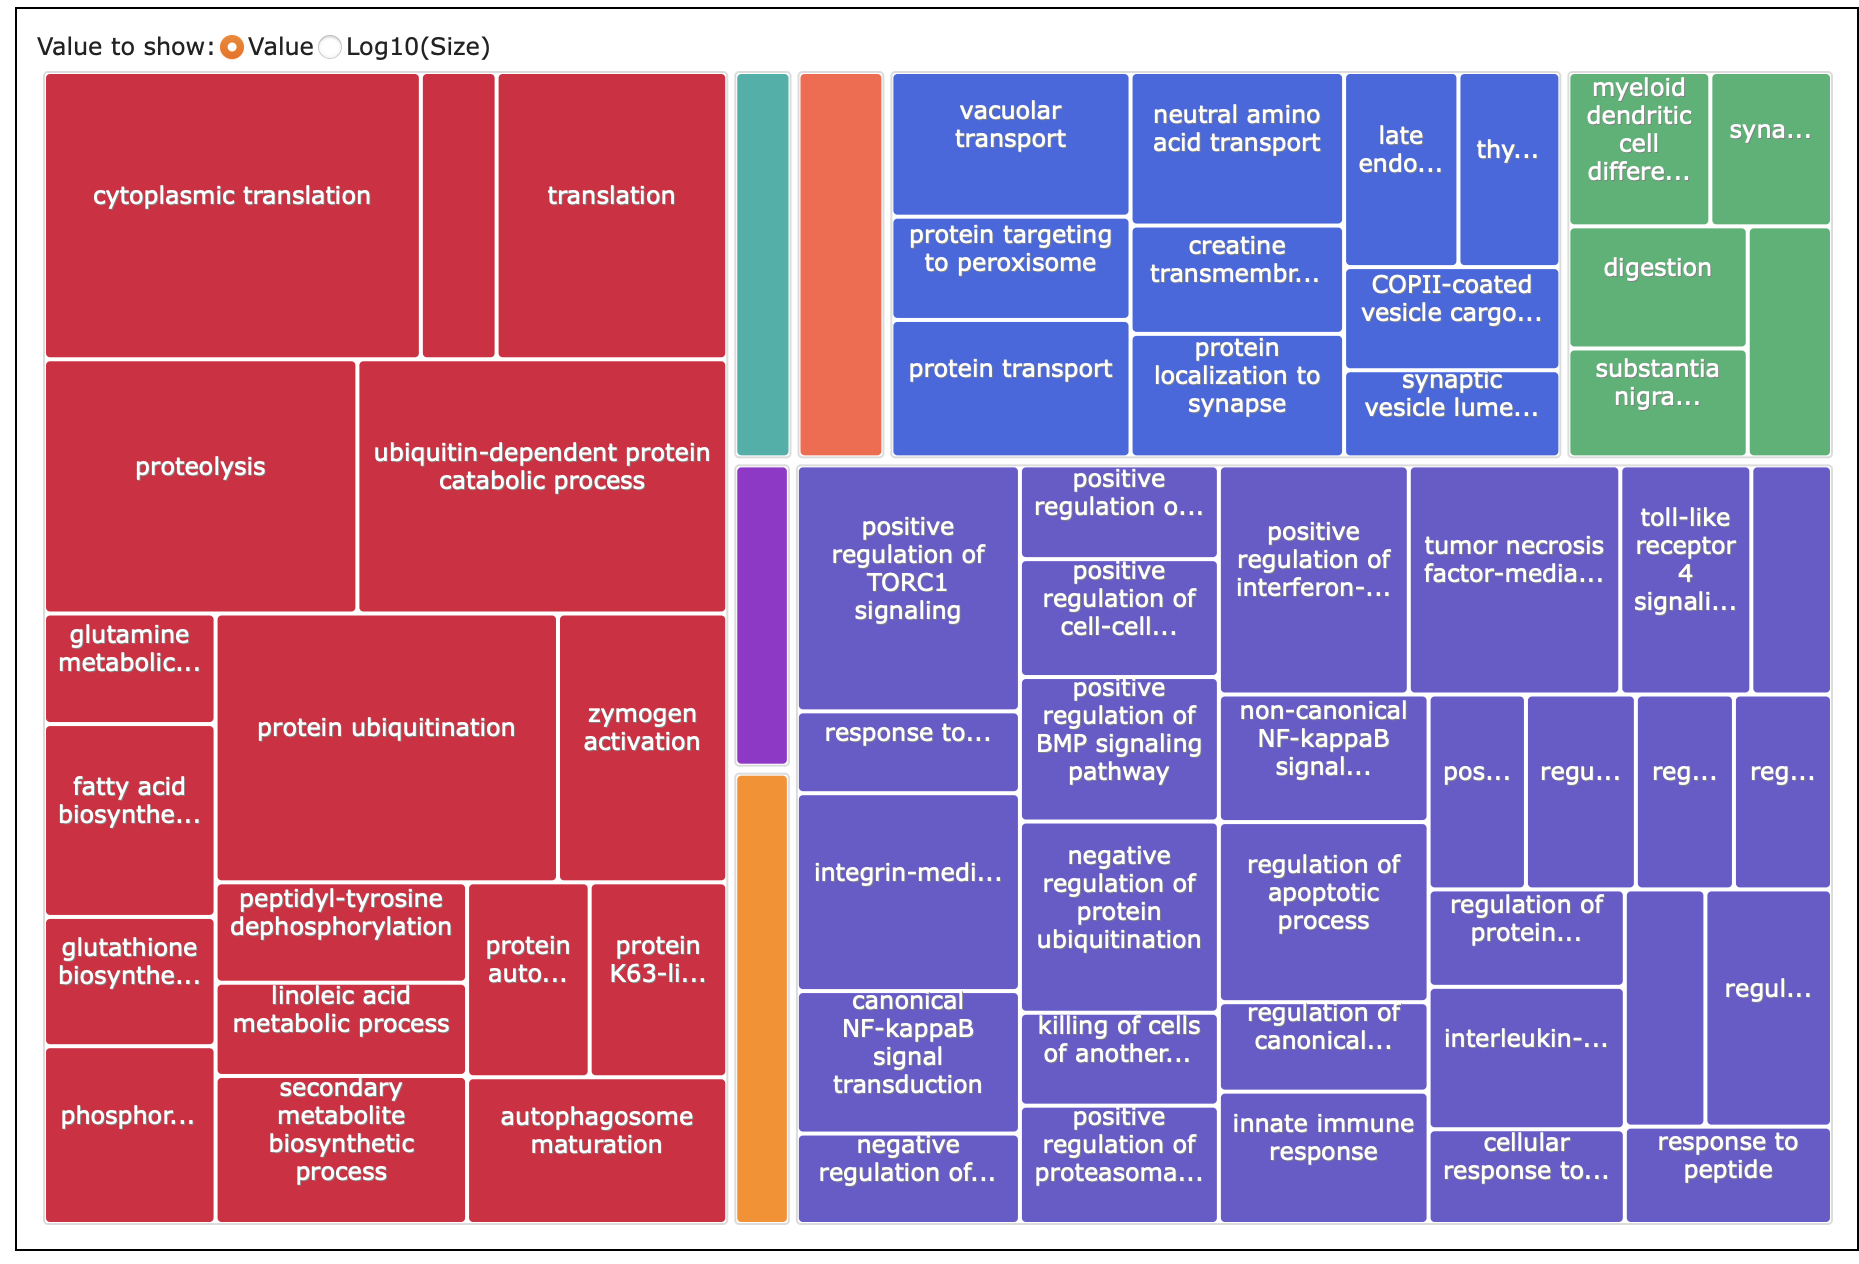
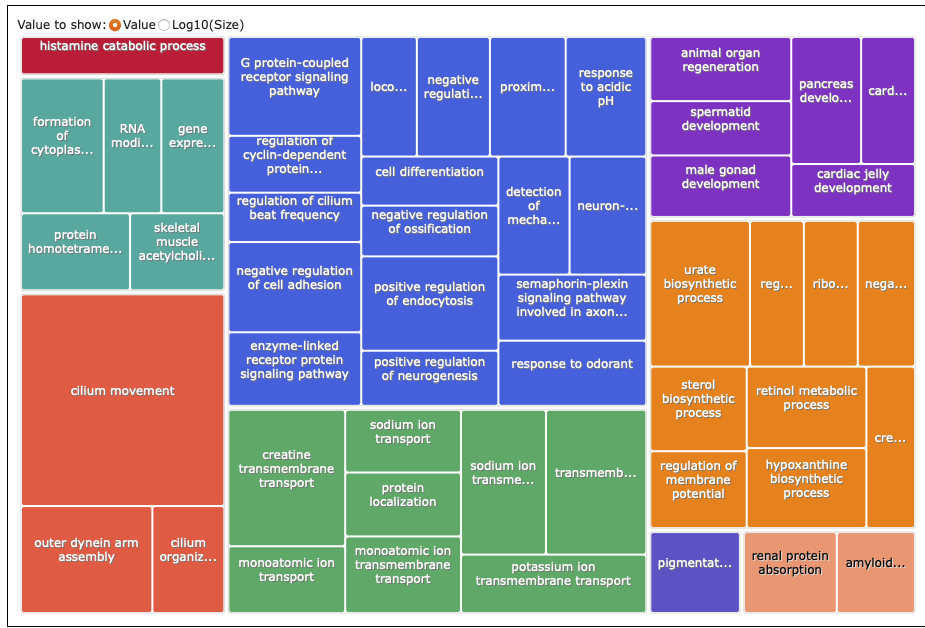
What I put into REVIGO: paper-pycno-sswd-2021-2022/analyses/24-2021-2022-enrichment/2022-controlVexposed-withage-for-REVIGO.txt. GO terms with p-value <0.05. 97.
Treemap table: paper-pycno-sswd-2021-2022/analyses/24-2021-2022-enrichment/2022-controlVexposed-withage-Revigo_BP_TreeMap.tsv
Treemap:
Age contrast –> getting DEGs from above comparison that are related to age in the control vs exposed comparison
82 DEGs.
Annotation
DEG list annotated: paper-pycno-sswd-2021-2022/analyses/23-annotating-deg-lists/DEGlist_2022_exposedVcontrol_withAgeContrast_annotated.tab
Enrichment
DAVID output with genome blast uniprot accession IDs as background):
Significantly enriched processes:
NONE. See table linked above, but the values that aren’t p-values are too high.
REVIGO
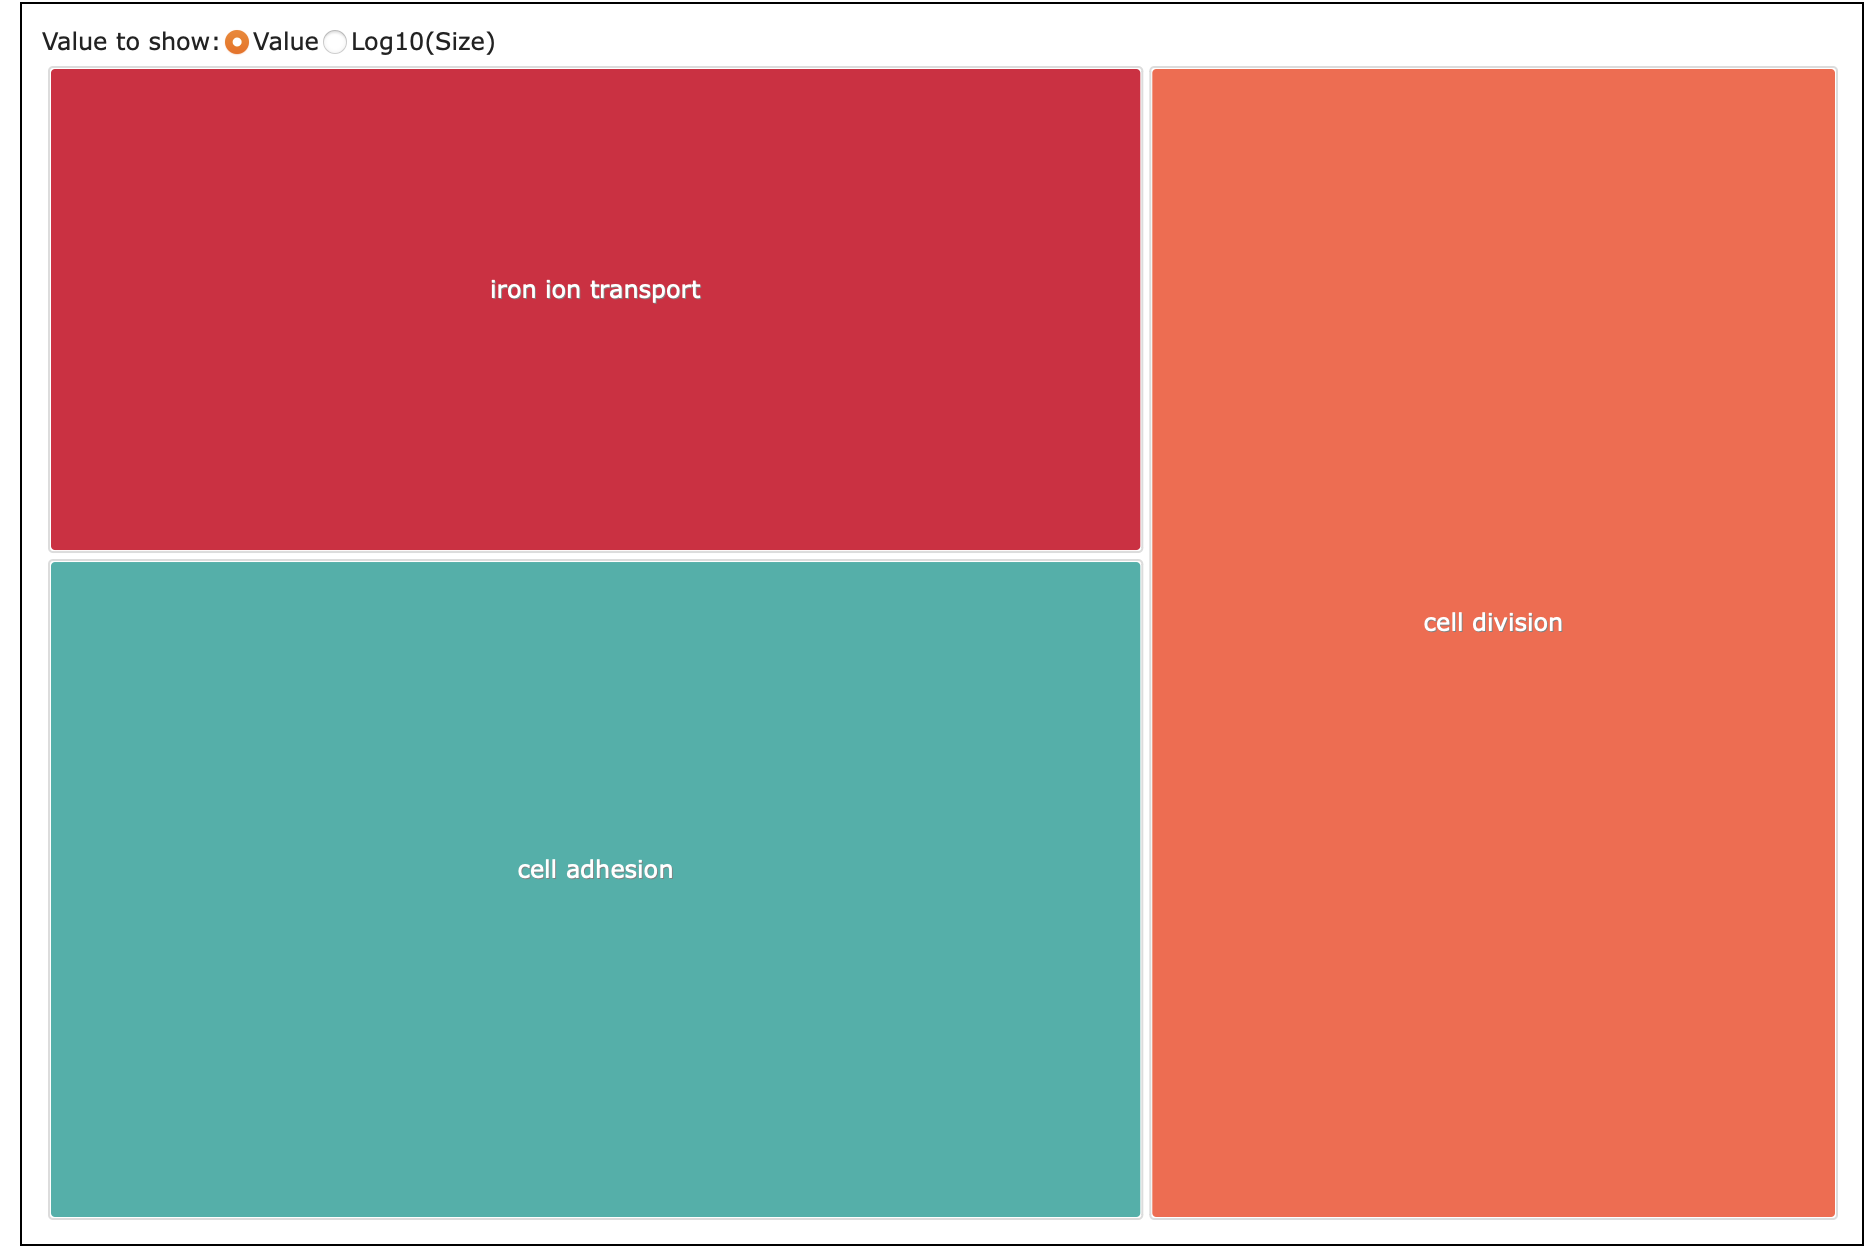
What I put into REVIGO: paper-pycno-sswd-2021-2022/analyses/24-2021-2022-enrichment/2022-controlVexposed-agecontrast-forREVIGO.txt. GO terms with p-value <0.05. 4.
Treemap table: paper-pycno-sswd-2021-2022/analyses/24-2021-2022-enrichment/2022-controlVexposed-agecontrast-Revigo_BP_TreeMap.tsv
Silly treemap:
Comparing 2021 Control V Exposed DEGs to 2022 Control V Exposed DEGs
R Code: 25-compare-2021-2022.Rmd
Output folder: analyses/25-compare-2021-2022
DEGs unique to 2021
Used anti_join from dplyr:
DEGlist_unique_2021.tab
Enrichment:
Unique 2021 DEG uniprot accession IDs put in DAVID: analyses/24-2021-2022-enrichment/2021-DEGlist_uniprot_Accession_forDAVID.txt.
Background: analyses/24-2021-2022-enrichment/blast_uniprotAccession_forDAVID.txt
DAVID output:
analyses/24-2021-2022-enrichment/2021-unique-DAVID.txt. 98 GO terms.
KEGG Pathways:
analyses/24-2021-2022-enrichment/2021-unique-kegg-DAVID.txt.
REVIGO:
What I put into REVIGO: analyses/24-2021-2022-enrichment/2021-unique-for-REVIGO-GOpval.txt
Treemap:
DEGs unique to 2022
Used anti_join from dplyr:
DEGlist_unique_2022.tab
Enrichment:
Unique 2022 DEG uniprot accession IDs put in DAVID: analyses/24-2021-2022-enrichment/2022-uniqueDEGs-uniprotacc-for-DAVID.txt
Background: analyses/24-2021-2022-enrichment/blast_uniprotAccession_forDAVID.txt
DAVID output:
analyses/24-2021-2022-enrichment/2022-unique-DAVID.txt. 93 GO terms.
KEGG Pathway:
analyses/24-2021-2022-enrichment/2022-unique-kegg-DAVID.txt.
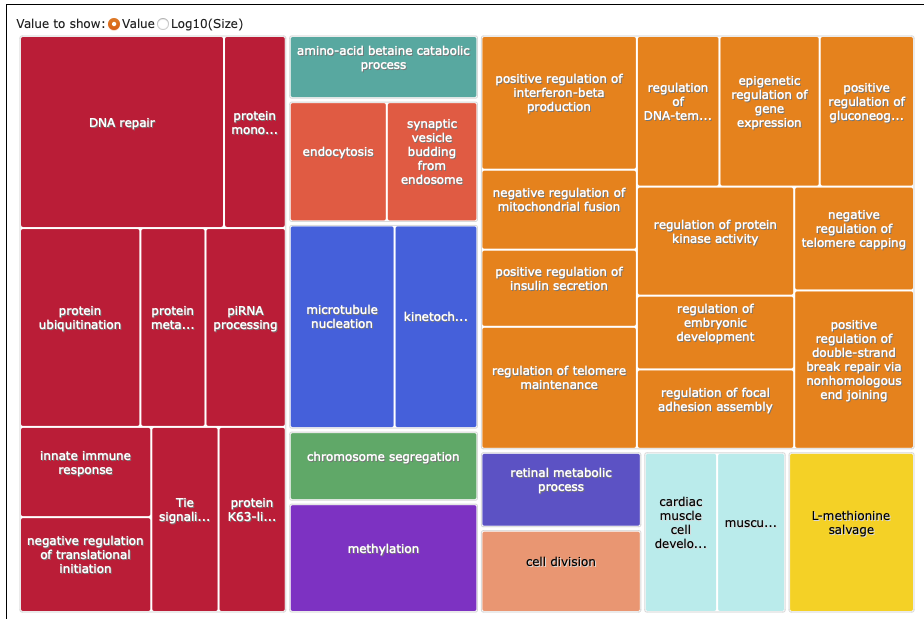
REVIGO:
What I put into REVIGO: analyses/24-2021-2022-enrichment/2022-unique-forREVIGO.txt
Treemap:
DEGs same across 2021 and 2022:
Used inner_join from dplyr:
DEGlist_same_2021-2022.tab.
Enrichment:
DEGs same across 2021 and 2022 uniprot accession IDs put into DAVID: analyses/24-2021-2022-enrichment/2021-2022-same-degs-uniprot-acc-for-DAVID.txt.
Background: analyses/24-2021-2022-enrichment/blast_uniprotAccession_forDAVID.txt.
DAVID output:
analyses/24-2021-2022-enrichment/2021-2022-same-DAVID.txt. 211 GO terms.
KEGG Pathway:
analyses/24-2021-2022-enrichment/2021-2022-same-kegg-DAVID.txt.
REVIGO:
What I put into REVIGO: analyses/24-2021-2022-enrichment/2021-2022-same-forREVIGO.txt
Treemap