Details and results of tying DEG results to orthogroups (Part I).
R code: project-pycno-multispecies-2023/code/26-figures.Rmd
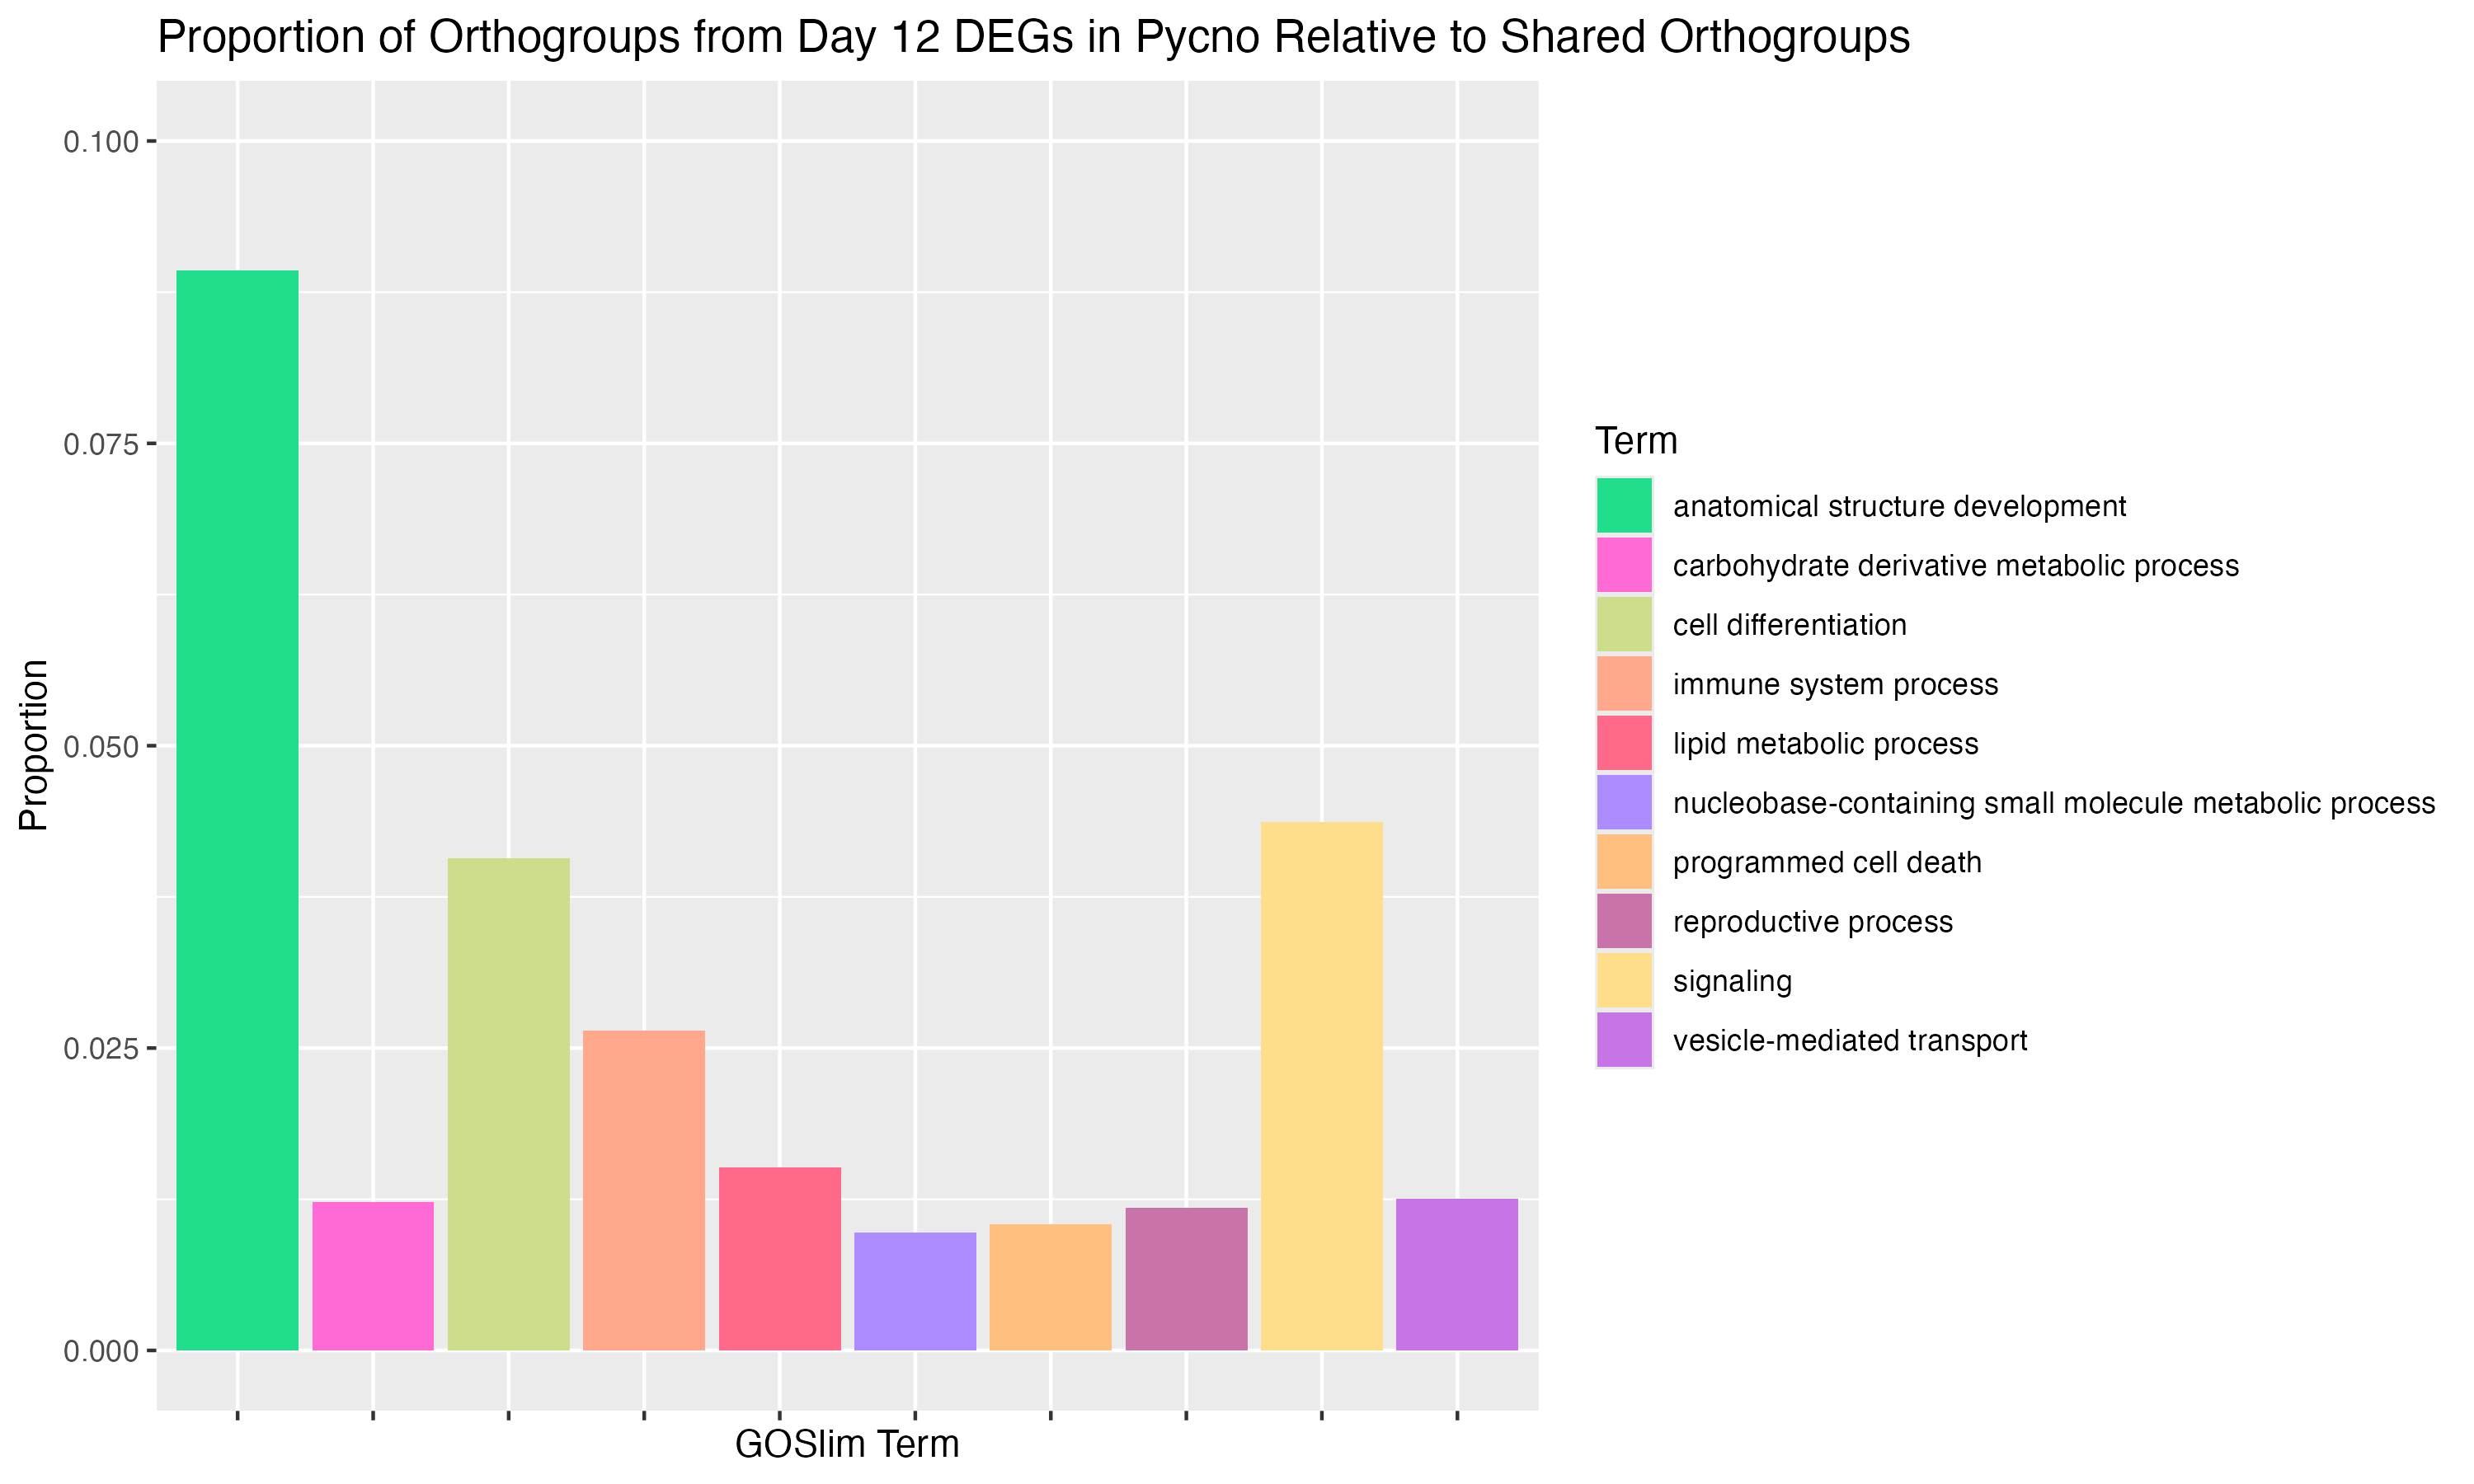
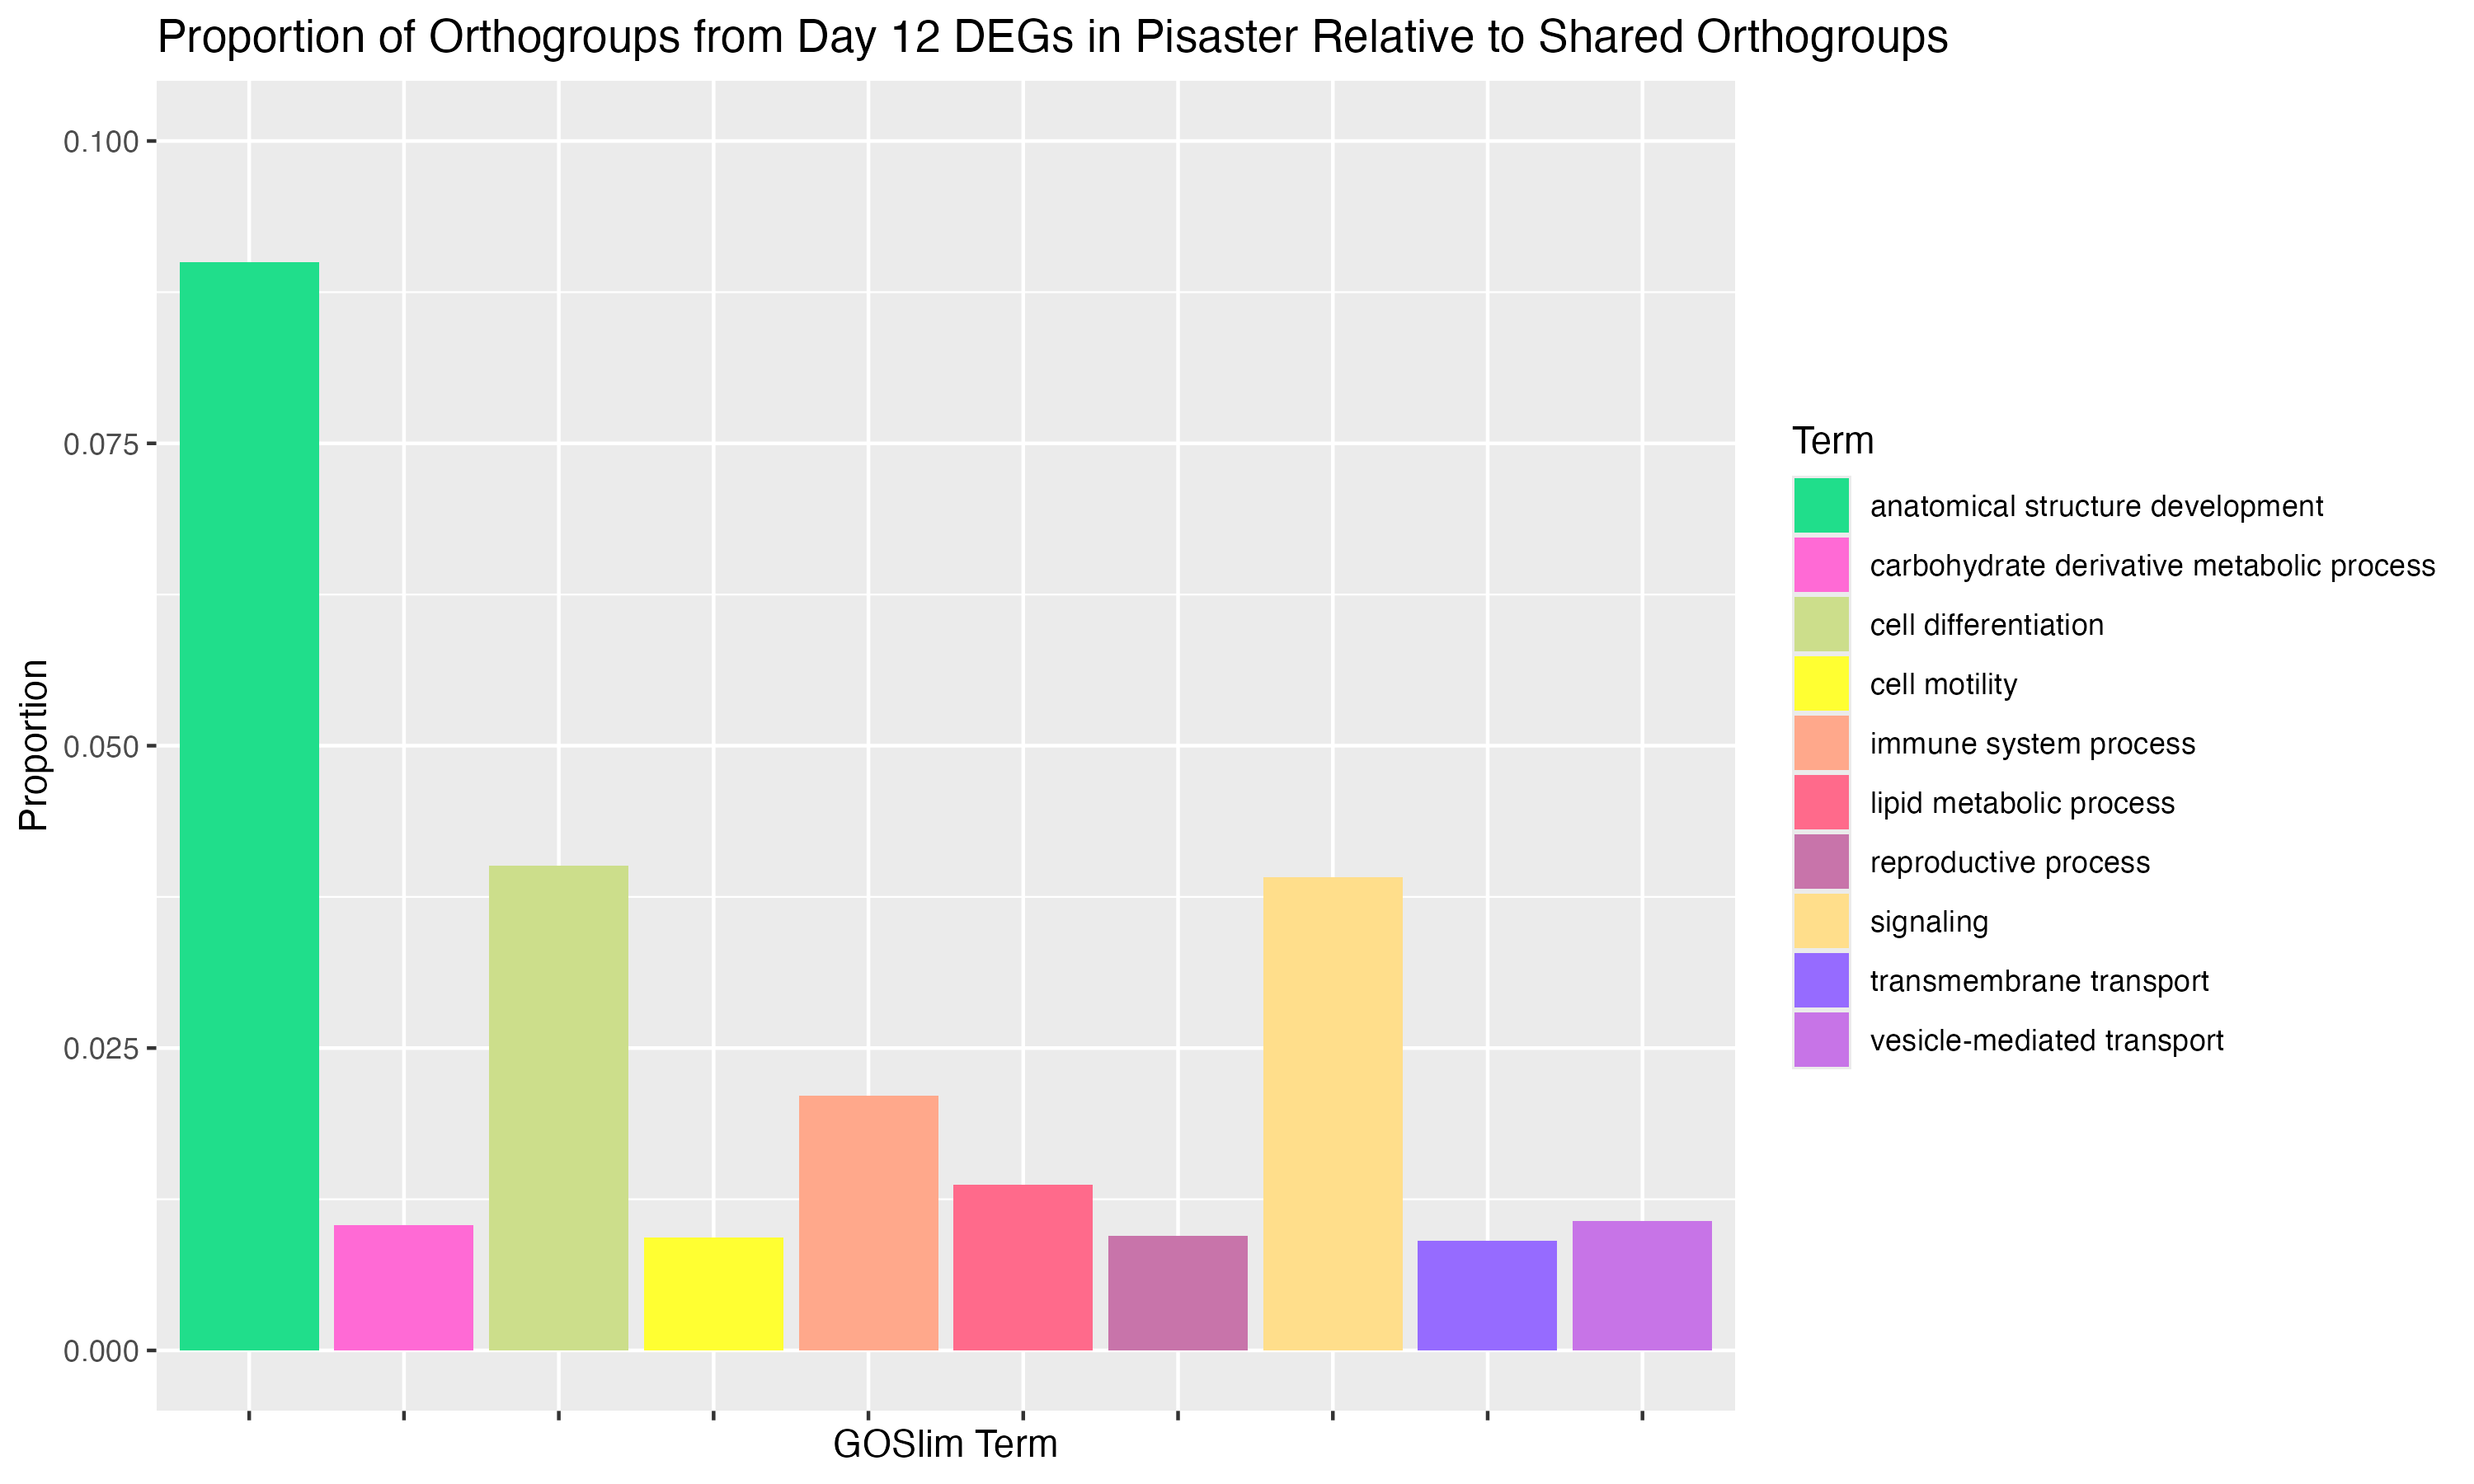
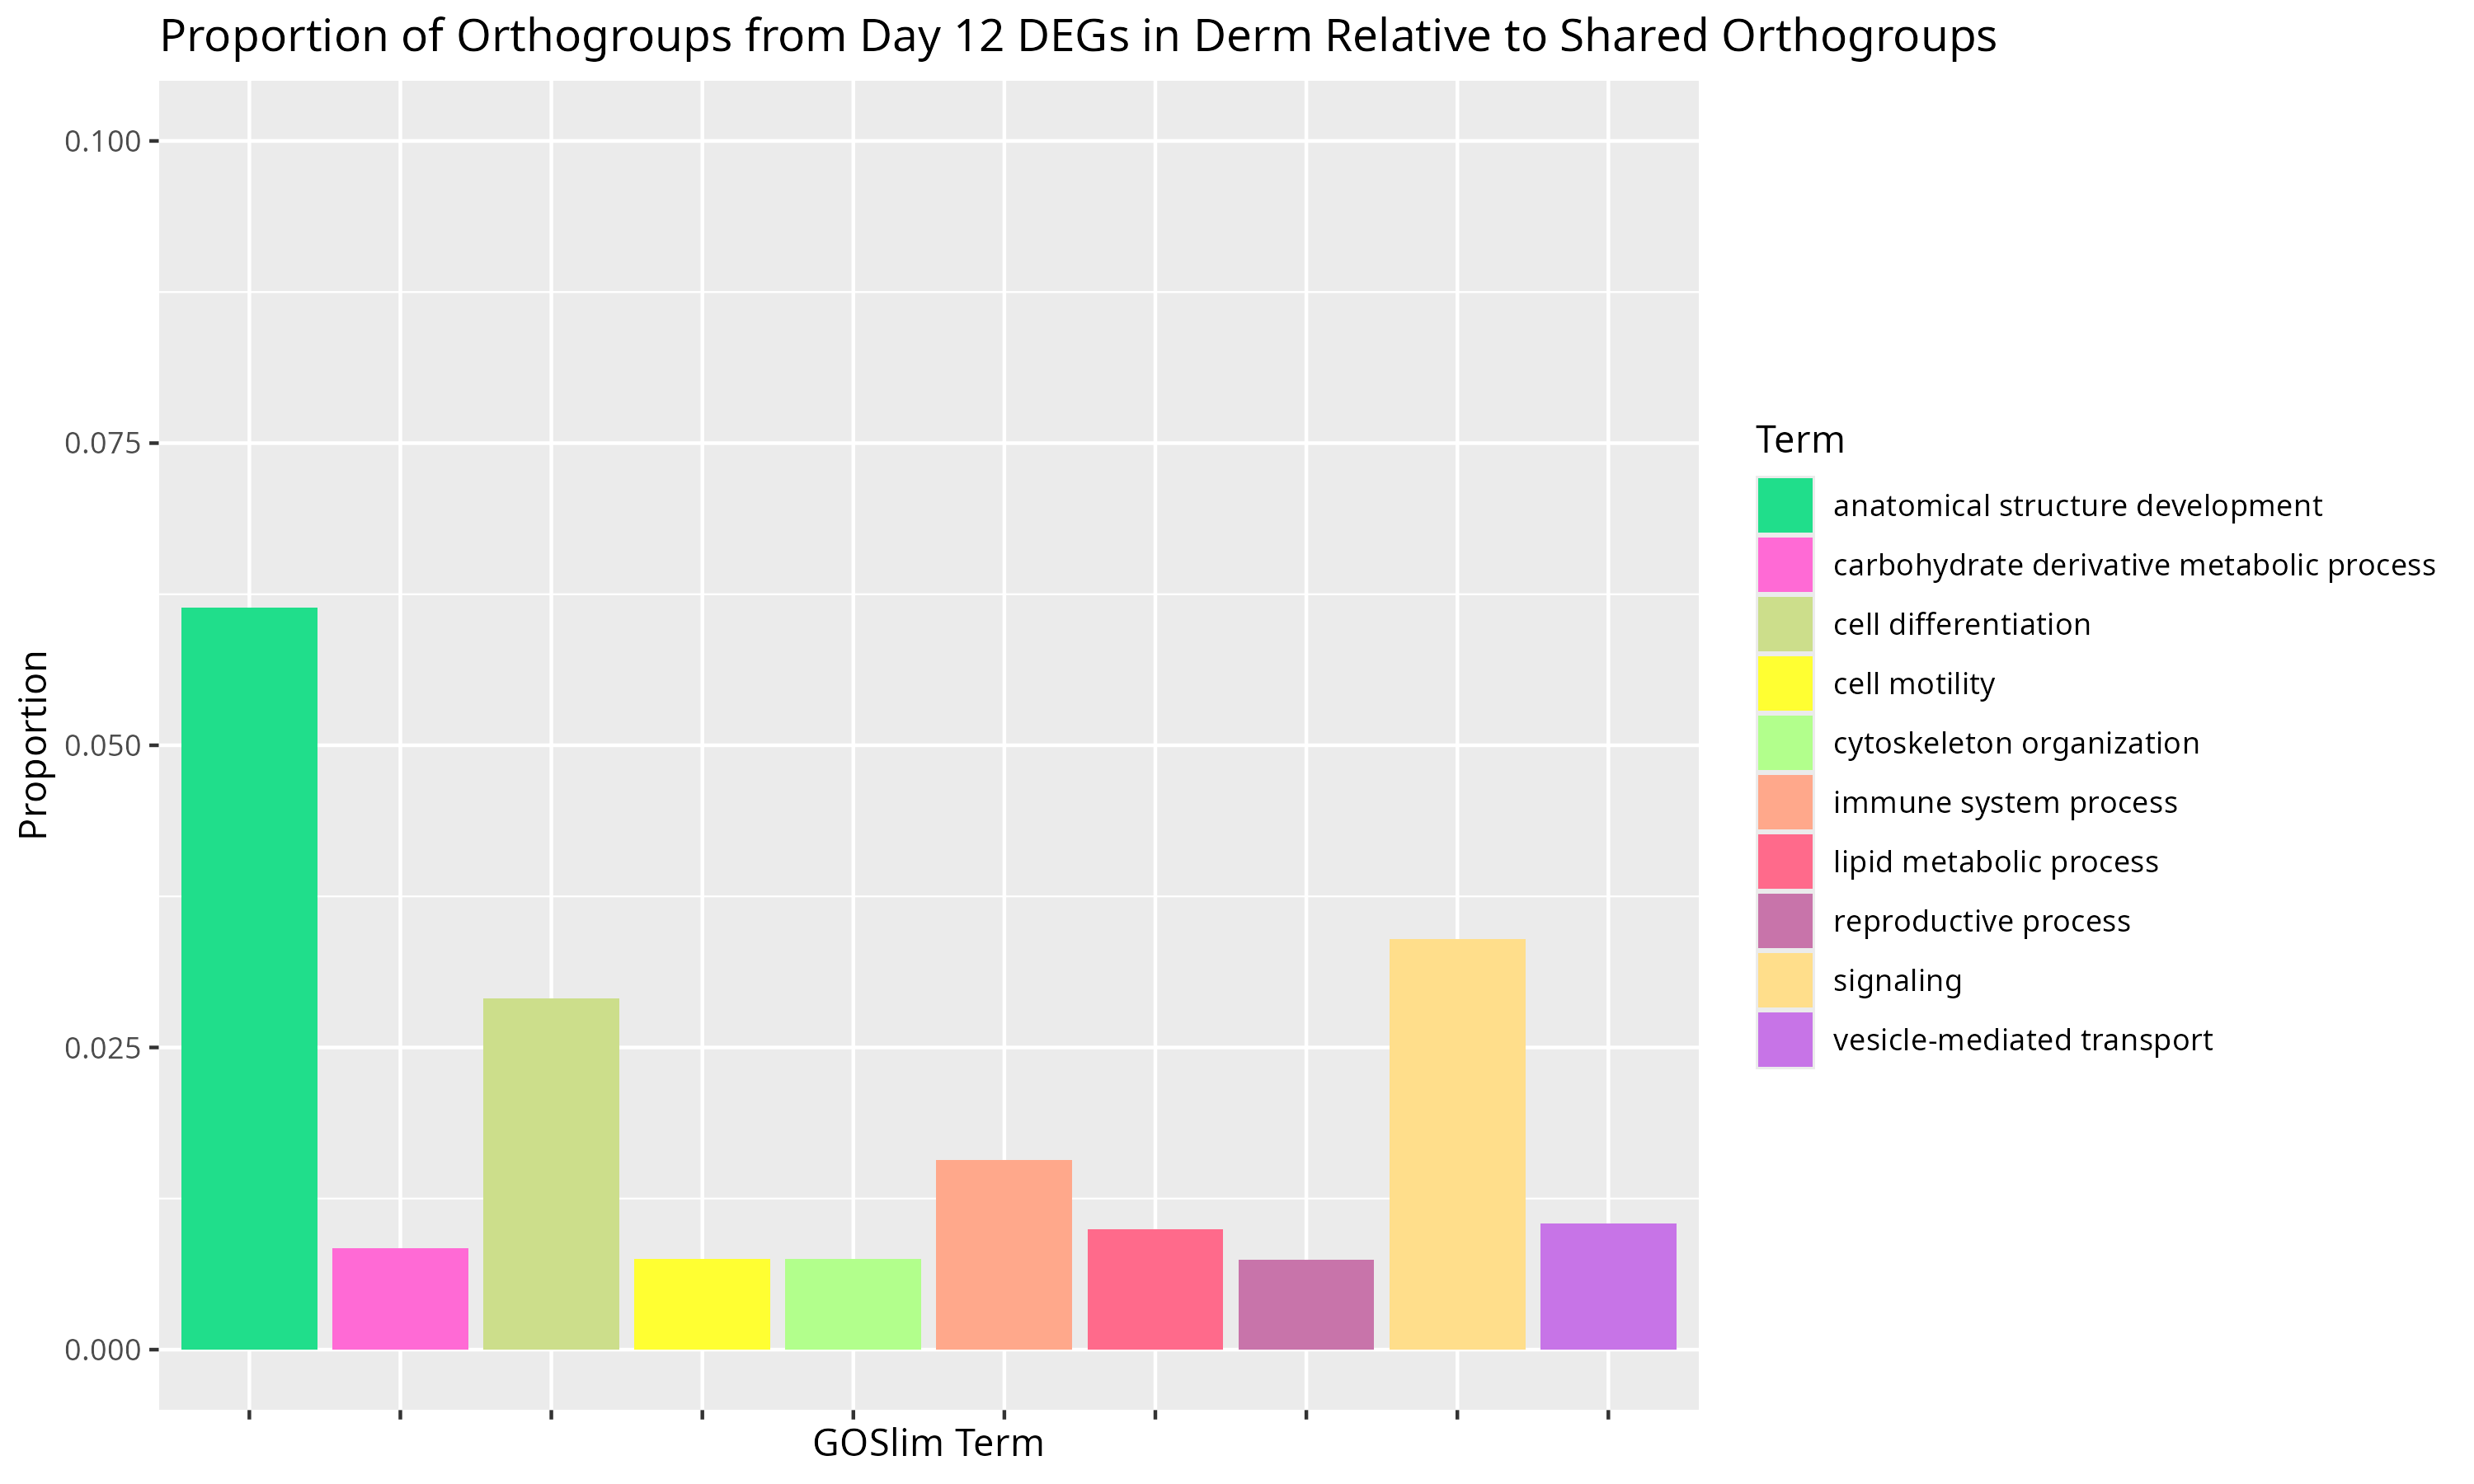
Each figure below is the same, but for each species. The data comes from the GOSlim lists of Day 12 DEGs from orthogroups that are unique to each species. The y-axis is the proportion of those Orthogroups unique to each species associated with the number of orthogroups (12547) shared across all three species.
P. helianthoides
Table used to create figure: project-pycno-multispecies-2023/output/25-degs-orth-GOSlim/GOSlim-DEGlist_pycnoDay12_all_unique_orthogroups.tab
P. ochraceus
Table used to create figure: project-pycno-multispecies-2023/output/25-degs-orth-GOSlim/GOSlim-DEGlist_pisasterDay12_all_unique_orthogroups.tab
D. imbricata
Table used to create figure: project-pycno-multispecies-2023/output/25-degs-orth-GOSlim/GOSlim-DEGlist_dermDay12_all_unique_orthogroups.tab
Thoughts and next steps
I think these figures are fine… I think it’s hard to compare across species currently, so I think a goal would be to have for each species a multi-panel plot of figures of the different GOSlim-deg+orthogroup lists comparing to all three species and to one or the other species…
Lots to sort through - lots of data!!!
Hopefully meeting with Steven later this week to go over these plots and anything else I come up with to come up with a next steps plan.