In preparation for tomorrow’s lab meeting, this post will include code and figures of making plots. PCA plots comparing different groups of RNA sequence data from Summer 2022 Pycnopodia helianthoides Sea Star Wasting Disease challenge experiments.
Summer 2022 Data
Up until this point, for Summer 2022 Data I have:
- Run QC
- Trimmed
Moved trimmed data from Mox to Raven so I can run kallisto.
I pseudoaligned the trimmed reads to the 2015 Up in Arms Phel transcriptome using kallisto on Raven: /code/03-kallisto-summer2022.Rmd
Output went in: /grace-ac/project-pycno-sizeclass-2022/analyses/Kallisto/2015Phel_transcriptome
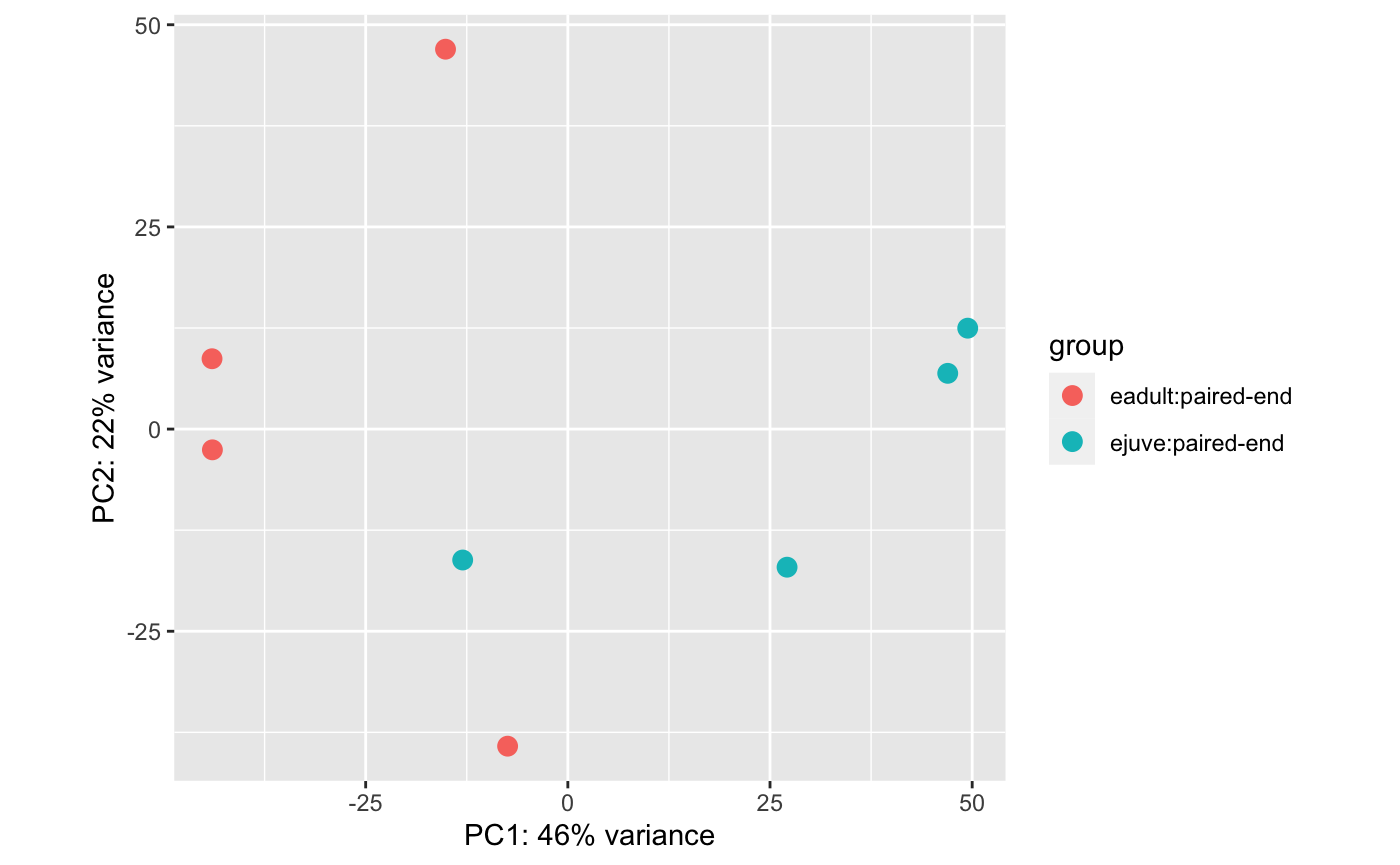
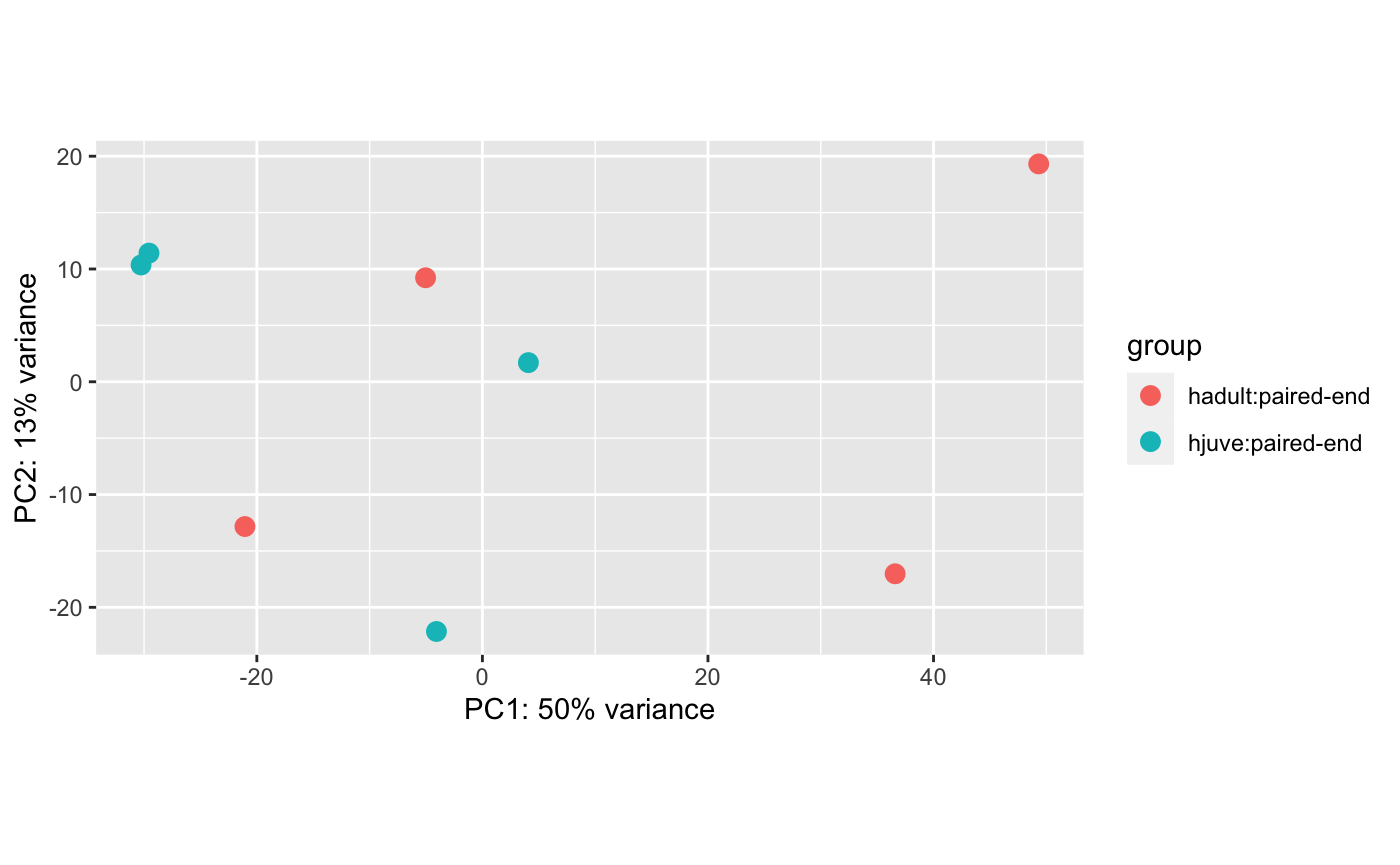
I then used this Rmd to create two PCA plots: /code/04-deseq2-summer2022.Rmd
Plots:
4 healthy adults at Day 0 compared to 4 healthy juveniles at day 0:
4 exposed adults after one arm has dropped compared to 4 exposed juveniles after one arm has dropped: