Rmd detailing use of topGO to get enrichment for each species at Day 6 and Day 12.
Steven and Claude did this:
I read through the code and clicked through it and recreated everything, but I didn’t quite learn it thoroughly.
So, I did a combination of reading the topGO manual, using chatGPT to help me understand the different code chunks, and created a new version of code that utilizes topGO to get enrichment. See details below.
Enrichment Files - Biological Process Only:
R Code: project-pycno-multispecies-2023/code/39-topGO-enrichment.Rmd
Output Directory: project-pycno-multispecies-2023/output/39-topGO-enrichment
Input files were annotated DEG lists from each species from Day 12:
pycD12 <- read.delim("../output/22-annot-DEGlists/DEGlist_transcripts_pycno_controlVexposed_annot_DAY12.tab")
pisaD12 <- read.delim("../output/22-annot-DEGlists/DEGlist_transcripts_pisaster_controlVexposed_annot_DAY12.tab")
dermD12 <- read.delim("../output/22-annot-DEGlists/DEGlist_transcripts_derm_controlVexposed_annot_DAY12.tab")
In all DEG files I removed the rows that had NA’s in the “Gene.Ontology.IDs” column.
Background files were annotated count matrices from each species:
pyc.all <- read.delim("../output/09-annot-pycno/Phel_transcript_counts_annotation.tab", sep = " ")
pisa.all <- read.delim("../output/10-annot-pisaster/Pisaster_transcript_counts_annotation.tab", sep = " ")
derm.all <- read.delim("../output/11-annot-derm/Derm_transcript_counts_annotation.tab", sep = " ")
In all background files I removed that rows that had 0s across all libraries in the counts.
Result files:
P. helianthoides
P. ochraceus
D. imbricata
The output files all have the below columns:
| GO.ID | Term | Annotated | Significant | Expected | Fisher |
|---|---|---|---|---|---|
| GO:0006412 | translation | 387 | 191 | 103.29 | 4.3e-15 |
The above row below the column names is the first line from pycno.D12.topGO_ALL_BP_results.csv.
From chatGPT:
- GO.ID: GO Term ID
- Term: Biological process
- Annotated: Number of genes in the background that are annotated with a GO term. Reminder: the background is the count matrix from each species.
- Significant: Number of the DEGs that are annotated with that GO term
- Expected: The number of DEGs that would be exptected to have the GO term if differential expression were completely random.
- Fisher: the p-value for the Fisher’s Exact test. If p-value is small it means that observed is very different from expected, and if p-value is closer to one, it means that observed is roughly similar to what was expected (not significantly enriched).
Enrichment Summary Figure for Day 12 - Biological Process Only:
R code: project-pycno-multispecies-2023/code/40-enrichment-figs.Rmd
Output directory: project-pycno-multispecies-2023/output/40-enrichment-figs
I made a quick dotplot figure with the help of chatGPT and google. I am showing the top 10 significantly (Fisher p-value <0.05) enriched GO terms for each species.
To orient you to the figure:
- x = enrichment significance
- y = GO term
- point size = number of DEGs
logP was calculated by making the negative log p-value of the Fisher’s p-value. Example code:
pyc.table <- pyc.table %>%
    mutate(logP = -log10(Fisher))
As a reminder, the enrichment significance means the count (number) of DEGs that are annotated with that GO term.
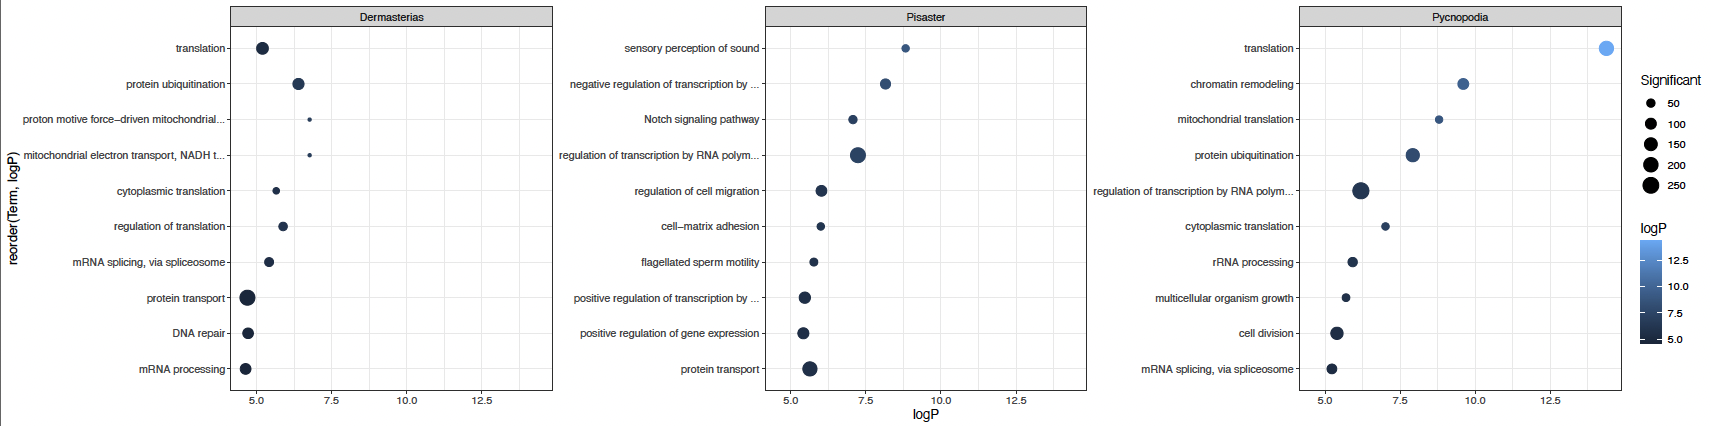
Sharing with pycno team folks tomorrow
Tomorrow I’m meeting with Alyssa, Melanie, and Kate just in a casual chat. They want to see what I’ve been up to, so I’ll show them the above figure and what Steven did and we’ll chat about it.