Today I fiured out how to make pie charts in R, and I did so with the taxonomy output from the BLAST with the C. bairdi transcriptome and the nt taxonomy database. I mostly worked on my repo for Fish546, and it’s still a work in progress. Also, update on crab extractions - Bioanalyzer isn’t reading chips….
Pie charts in R
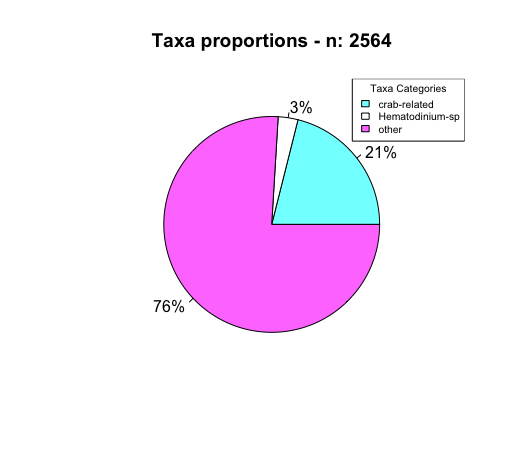
This was tricky because as I note in the script, the pie chart was made based off of how many proteins came from animals whose common name included the word “crab”. When I took a closer look at the data, I noticed that (in particular) some Chionoecetes sp. didn’t have a common name associated with them, and instead just had their genus species repeated… So I had to add in the “Chionoecetes” -specific label to grep. I can’t be sure if the same didn’t happen for other crab species whose scientific name I don’t know and whose common names are listed as repeats of the scientific name…
I’m currently working on creating a pie chart that focuses in on the composition of the crab proteins based on the unique species… it’s proving to be a bit difficult, so I may make an issue related to figuring this out if I can’t figure it out when I revisit it later. taxa-crab-breakdown.R
Bioanalyzer - sidenote
The bioanalyzer isn’t able to read the RNA chips…
But Steven suggested that I work with the eight samples I have extracted and run on the Qubit (post:11/21/18) and try to get them to “library ready”… meaning that I need to make sure that the samples are pure and the quantification is accurate (Bioanalyze and Nanodrop), and I need to create the pool such that each sample contributes an equal amount of RNA to the pool.