Trying out a join in R to figure out what I have in terms of isolated RNA samples.
Data organization
Today I combined the qPCR and DNA Qubit data from Pam with the subset of samples that had 20ng/µL of RNA or higher and three samples per crab based on FRP.
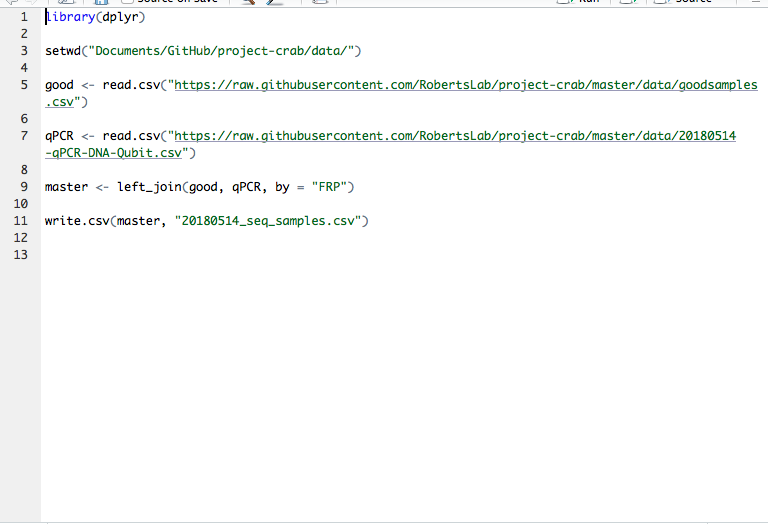
This is the code I used:
The file (raw: is kind of crazy now. I want to figure out how to match the data within the spreadsheet between columns.
This file is all the samples that have:
- 3 samples per crab
- 20ng/µL RNA or higher
- Pam’s new data from qPCR (but only for the samples that have 3 samples/crab and 20ng/µL RNA or higher)
The file has three columns that I want to compare to see if the infection status of the samples has changed from what was originally determined by conventional PCR.
The initial column is “infection_status”. This column has “0” for uninfected and “1” for infected, based on conventional PCR.
A second column is “pos_neg_no_quant” and has “POS” for infected, and “NEG” for uninfected, and “0” as a placeholder for the empty cells.
A third column is “pos_neg” and has “pos” for infected, and “neg” for uninfected and “0” as a placeholder for empty cells.
On the “Notes” tab of qPCR_Qubit_results_to_Grace_050818.xlsx from Pam, it is explained that the POS and NEG are for the samples that do not have acceptable standard deviations, and thus no quantification, but are very clearly POS or NEG for Hemaatodinium sp. infection. The “pos” and “neg” are for those that have a sample Cq mean that exceeds the lowest concentration standard mean Cq (neg) or not (pos).
But, by the end of this week for sure, I will have a visual of all the good samples that I have within the different categories of treatments (infected, uninfected: cold, amb, and warm) and at all three sample dates so that I will know whether I need to isolate more samples, or if we can start preparing more seriously for sending them for sequencing.